
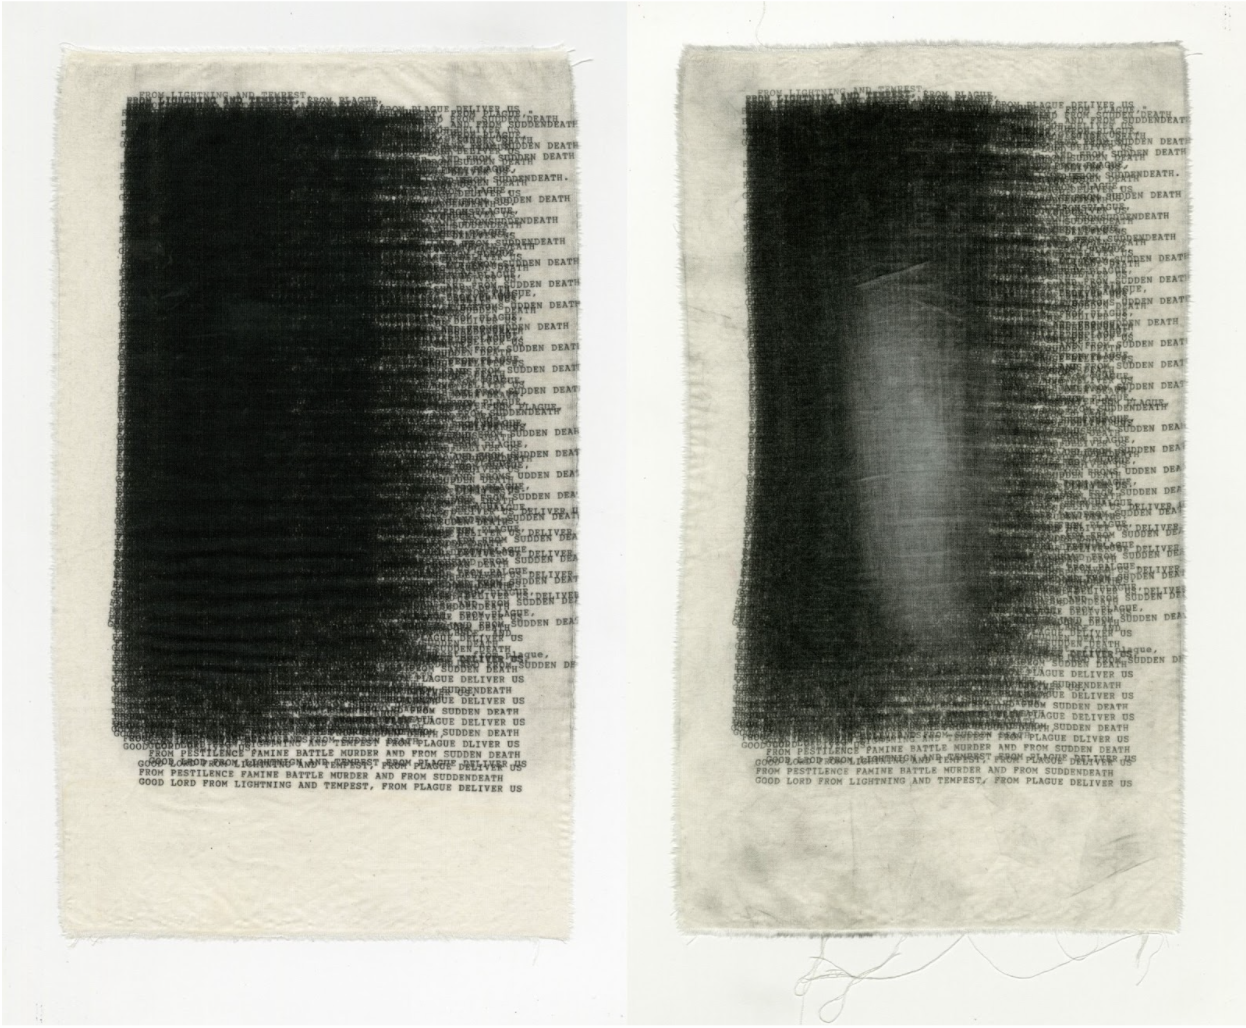
When my area went into lockdown in March of 2020, initial case counts were relatively low in my state, even as the coasts were plunged into crisis. As the days blurred together, I kept a journal to structure the time, penciling in Iowa’s daily case count next to my to-do lists. The number of cases hovered near 100 for a few days, but on April 1, 2020, the count spiked to 549. As I logged the number in my journal, it felt like the pandemic unfolding on the news was now at the door.
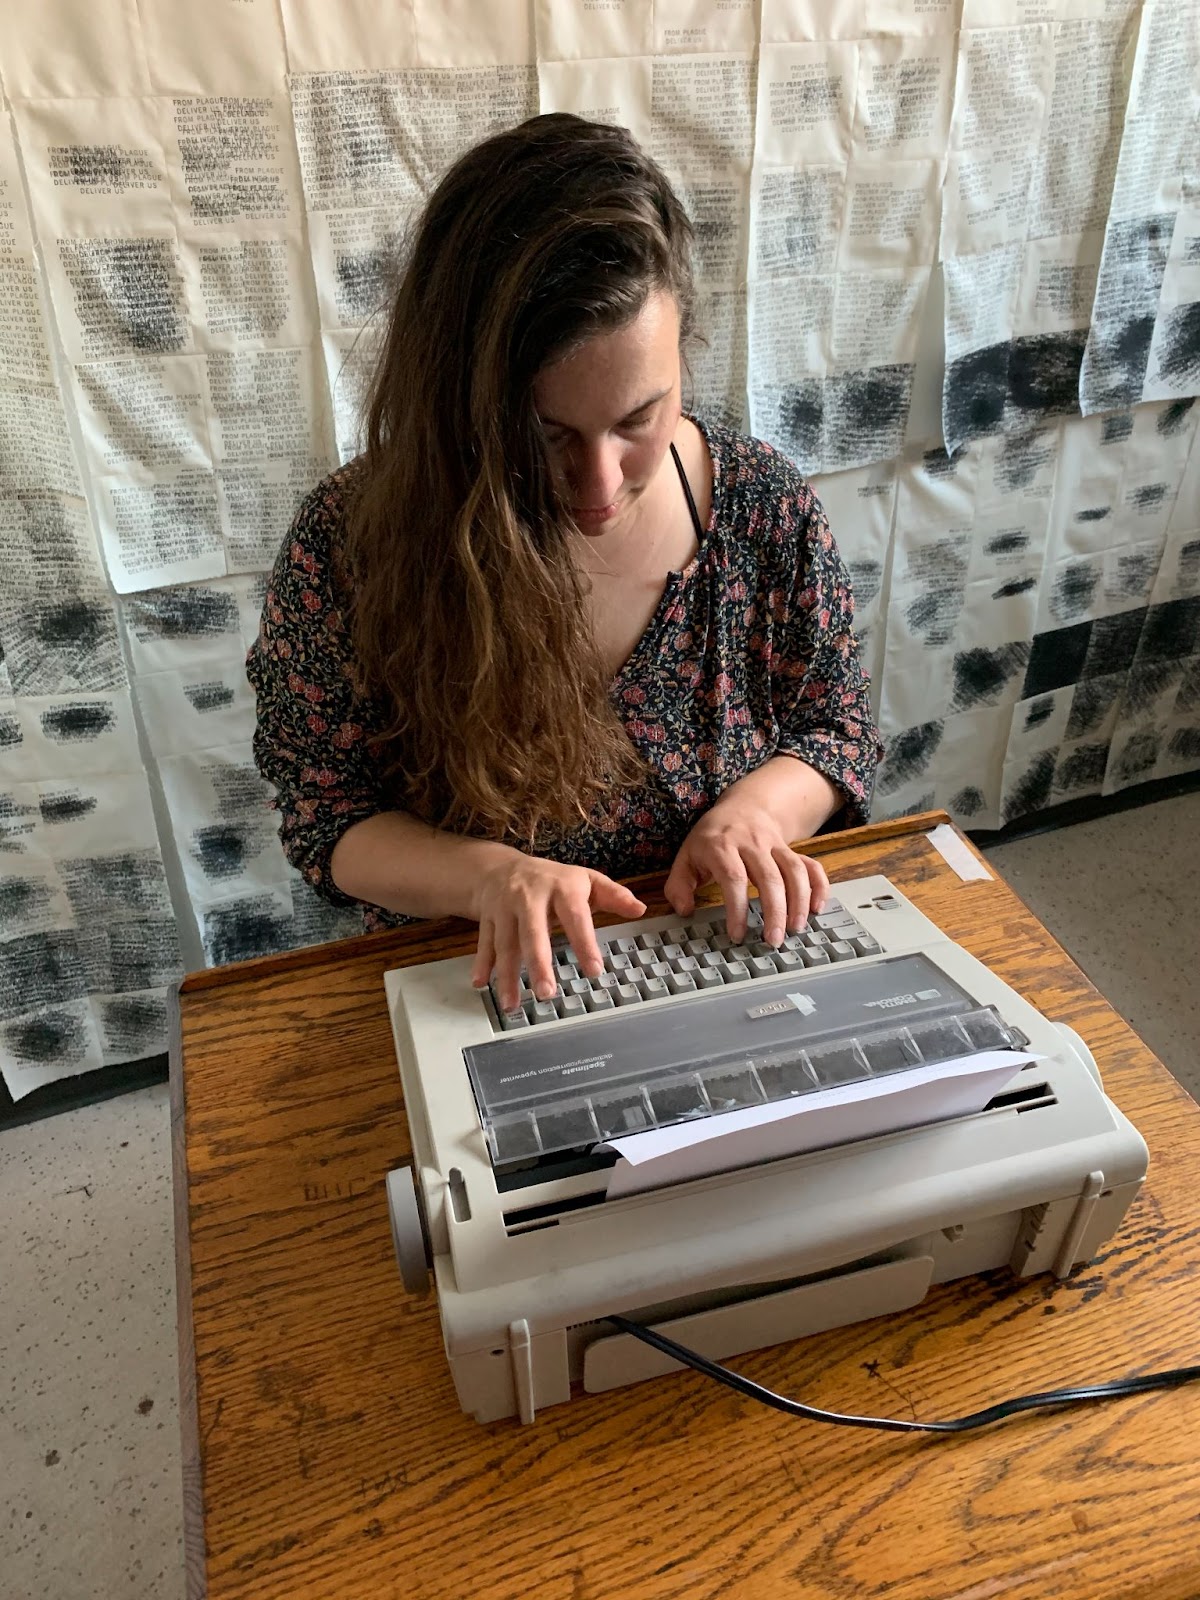
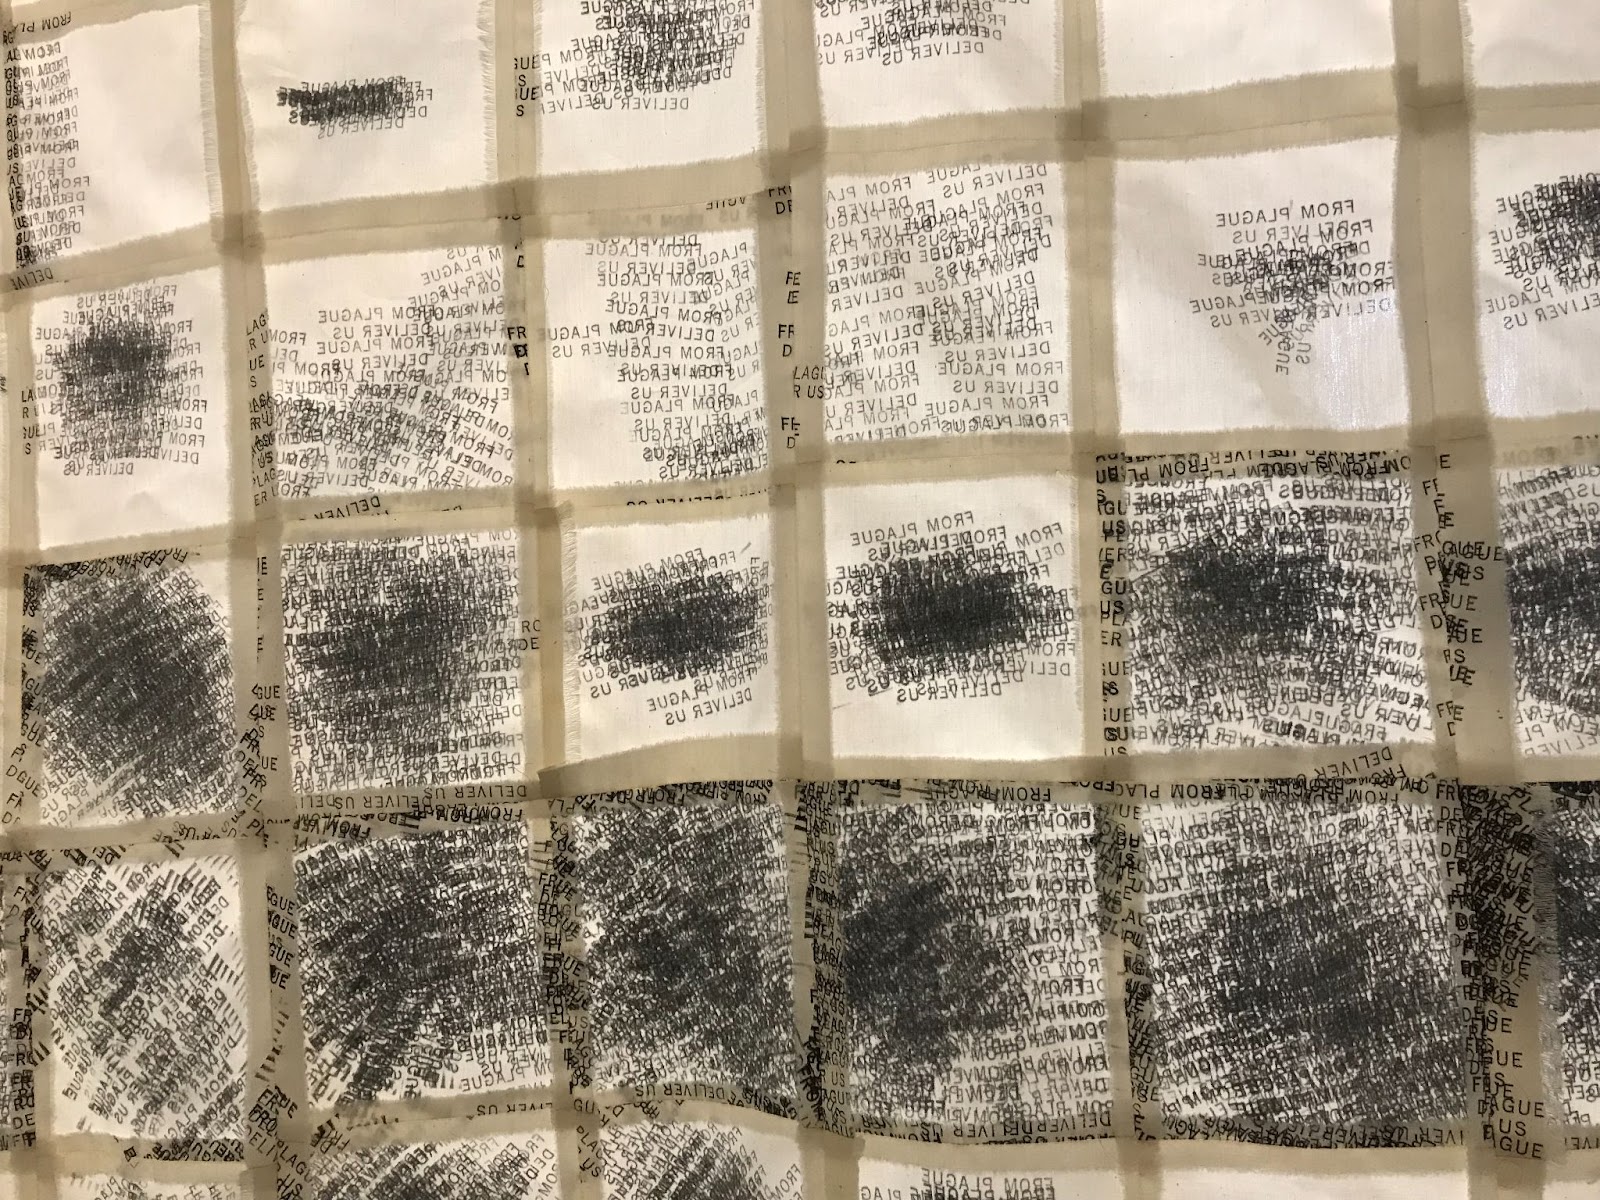
That day, I spent ten hours running a piece of cloth through my typewriter. I selected a few lines from the Book of Common Prayer to overtype 549 times, in all caps: “FROM PESTILENCE FAMINE BATTLE MURDER AND FROM SUDDEN DEATH GOOD LORD FROM LIGHTNING AND TEMPEST, FROM PLAGUE DELIVER US.” I’d recently learned that the Book of Common Prayer was compiled in the 16th century during the Black Death. That context may explain why the book’s many pleas for deliverance from plague still radiate urgency.
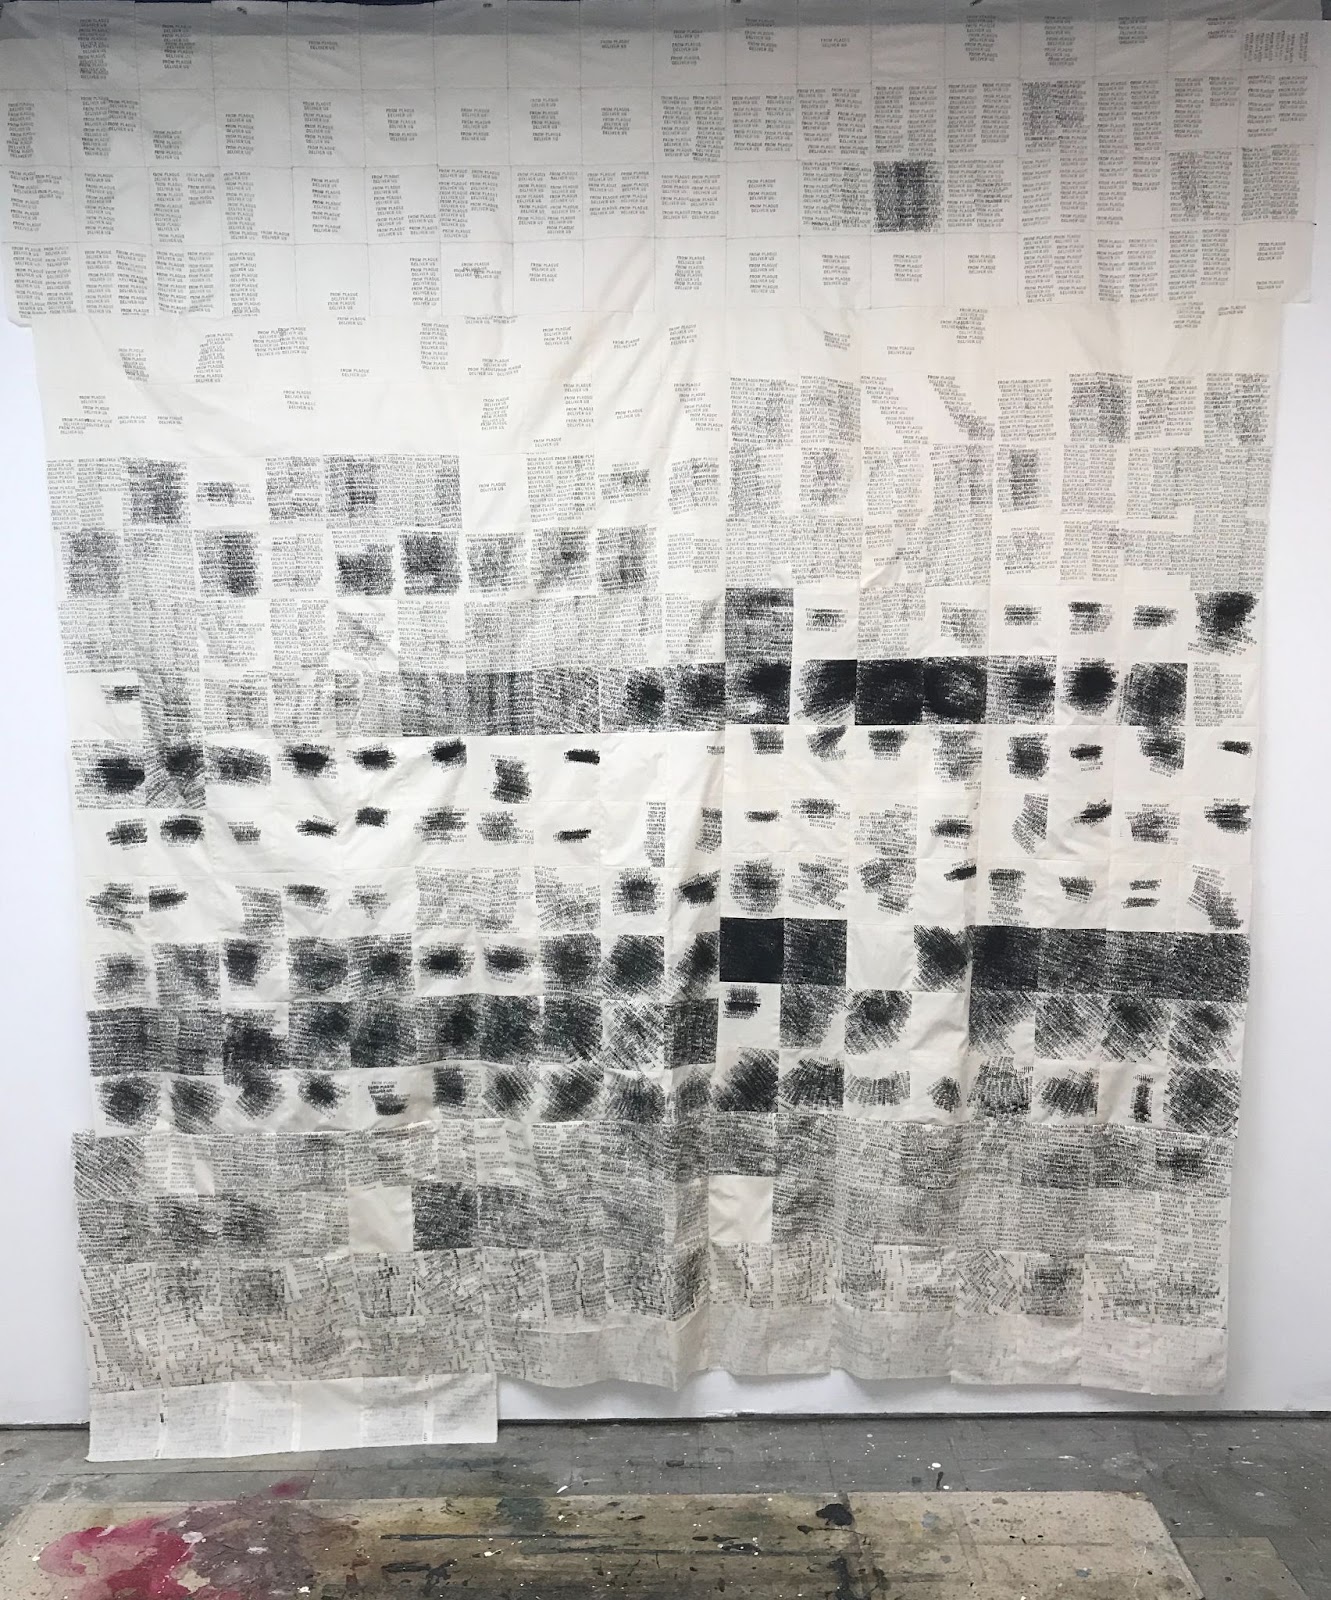
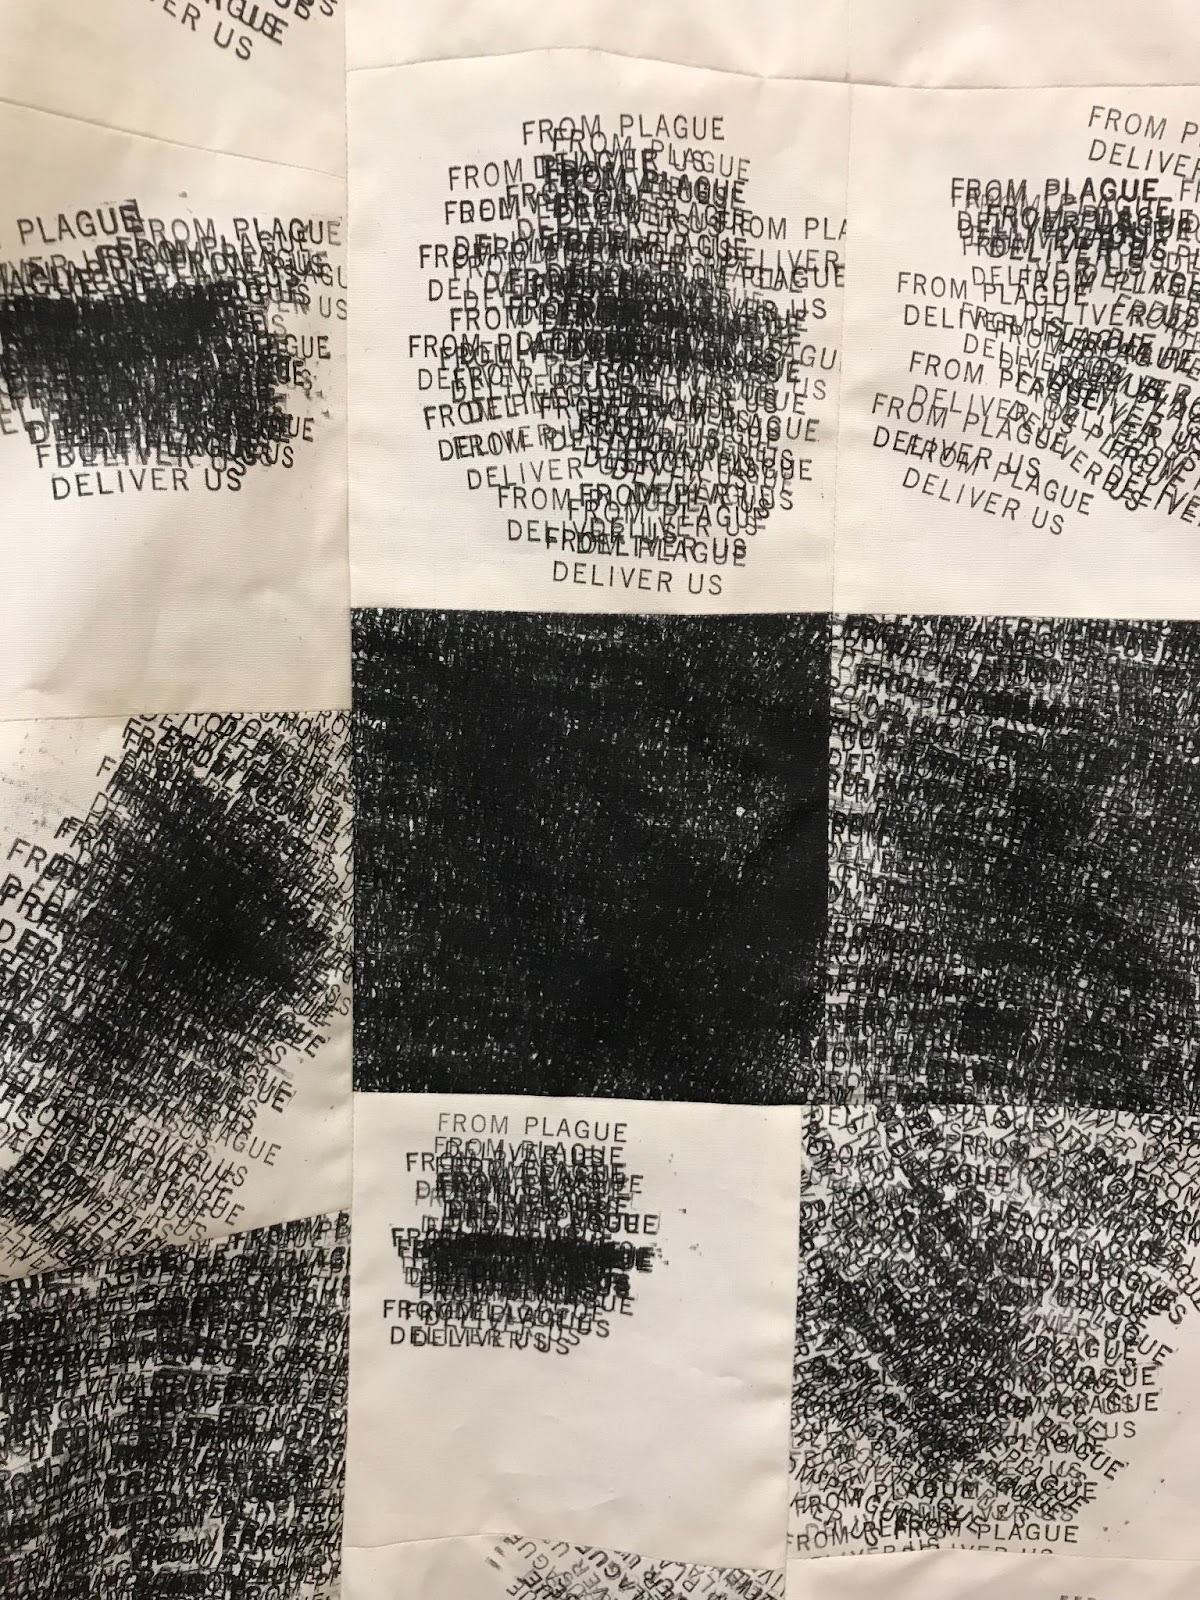
Eventually, I began to document daily case counts in my region of Iowa on a larger textile. I recorded cases every day, each with a stamped prayer, “FROM PLAGUE DELIVER US.” Prayers tend to be said on behalf of those closest to us, and a county was the smallest geographic area for which case counts were available. Working with data from Johnson County, IA, I recorded just the new cases each day, excluding recovery data or deaths. My intention for the final product was to situate both the act of prayer and the practice of art making as nuanced methods for approaching uncertain situations.
What happens when we can both see and touch data? I worked on DEMAND/PRAYER for about 20 hours a week over 18 weeks. I anticipated the project would be a sad one; I didn’t expect it to make me shake with anger while I sewed. It’s one thing to model cases digitally, and another to perform a small physical act of labor that acknowledges each person in a dataset. My anger was fueled by numbers from a relatively small area, compared to the pandemic’s global reach. I wondered if (and how) public policy outcomes might change if legislators, and the public, had a more embodied relationship to case data. As the writer Jenn Shapland claims, “I feel that there is a price we pay for disembodiment.” What might happen if those shaping public policy could touch and see the lives being impacted by this pandemic?
There are important elements of the pandemic in Johnson County that this textile does not capture, such as which demographic groups bore disproportionately high caseloads. Additionally, the piece represents all new cases in the county over the course of a year with a reference to a Christian text, the Book of Common Prayer. But, perhaps only a third of Johnson County’s residents are religious, and the local religious groups include Jews, Muslims, Buddhists, Hindus, and Christians. Given these demographics, my work is an example of how data art differs from data visualization. As an artist, my work recycles canonical Christian texts to assert that mystical and spiritual experiences happen within, and sometimes despite, established social structures.
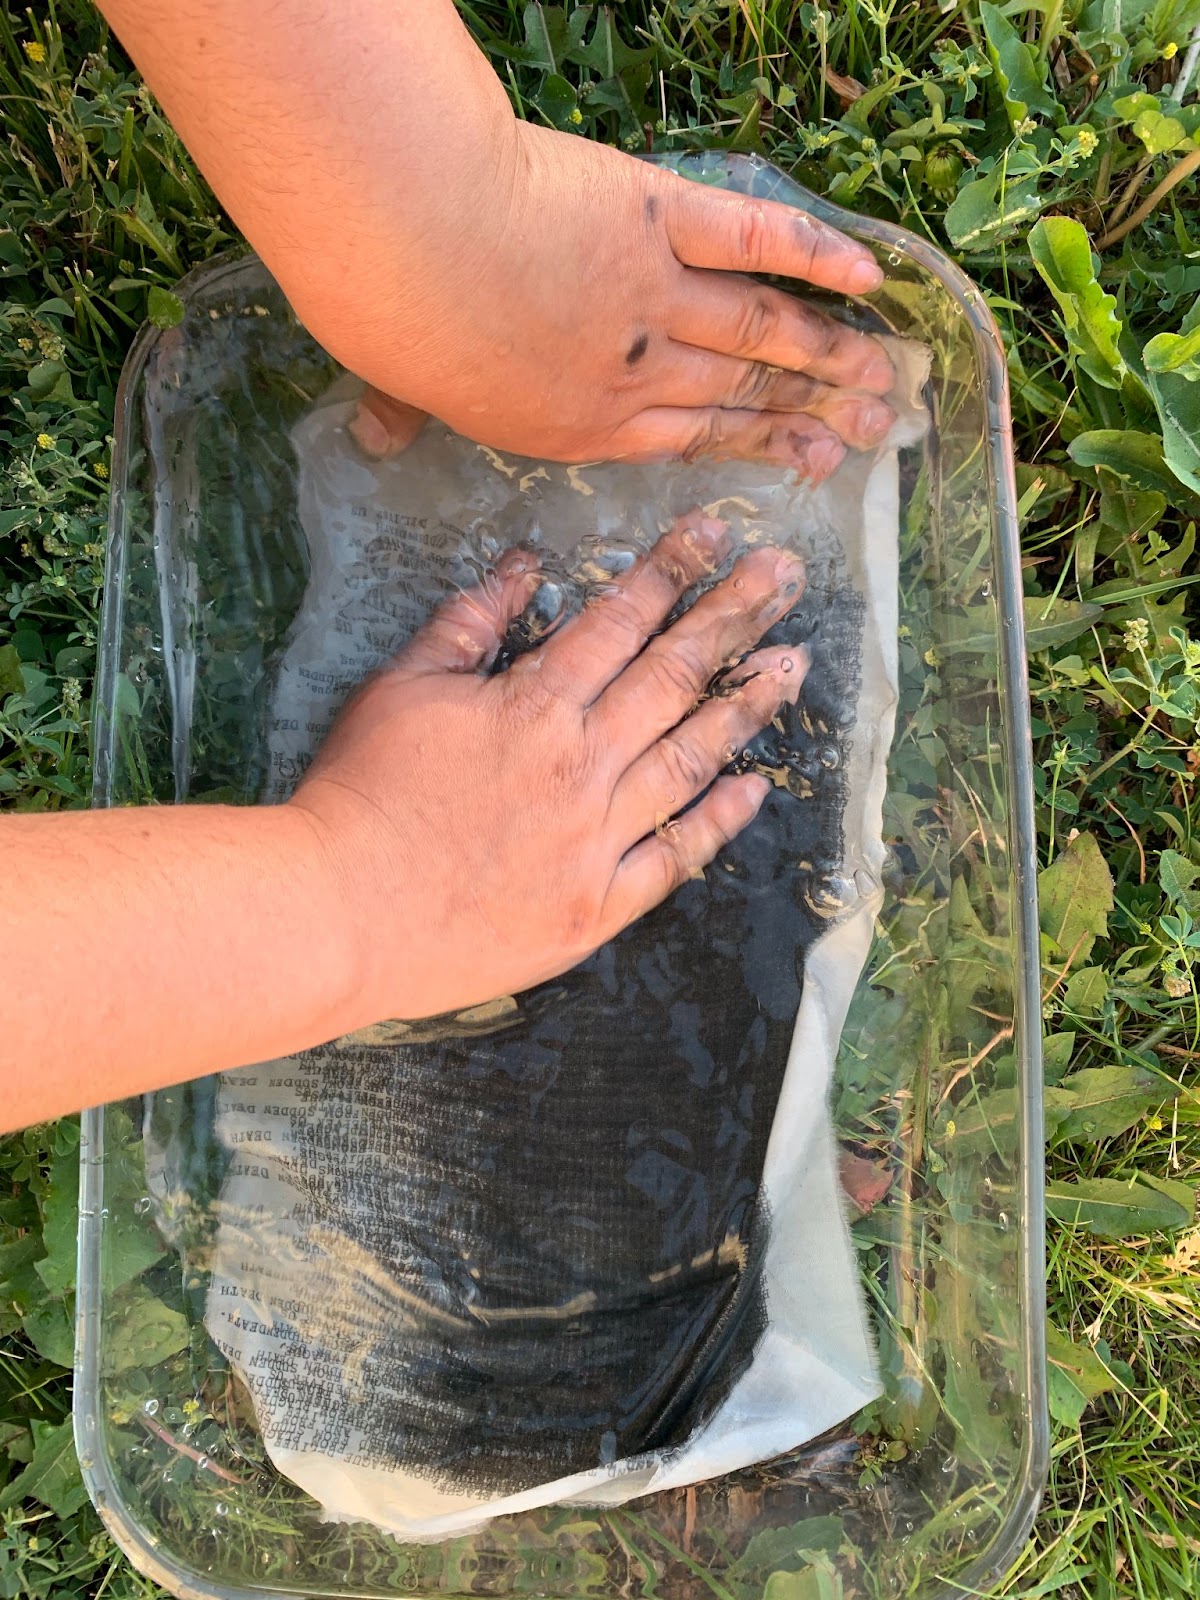
Cloth is a practical medium for my data physicalization projects: even durable paper can become worn out from repetitive stamping or typing. A second reason I use cloth is “computing’s historical dependency on textile design, its production methods, and its labor models.” Binary code was invented during the industrial revolution to automate weaving patterned cloth. Core memory, the first viable and widely adopted re-writable computer memory, was a conductive fabric which coded ones and zeros in magnetic beads as positive or negative charges. Core memory was woven by hand, and its fabrication resembled a combination of bead looming and pin loom weaving. A touchscreen technology often found in consumer electronics like tablets and smartphones relies on conductive grids that operate similarly to core memory planes. The anthropologist Stephen Monteiro draws parallels between needlework, touchscreen gaming, and image-based social media interfaces, arguing that “personal touchscreen device use resembles the actions, strategies, and conditions of craft production.”
Some data physicalizations are self-conscious of these connections, demonstrating integration between medium and message. Visualizing blockchain technology with yarn, knitting a blanket of sleep pattern data, and encoding the pace of global warming into winter wear—in these projects, yarn is a considered material choice. However, some textile data physicalizations leave me wondering why textiles were chosen as a medium for that data. To engage a certain demographic as makers or viewers of the data object? Because knitting, crochet, and embroidery are financially accessible techniques for making data physical? There’s nothing wrong with either motivation. However, many makers working at the intersection of textiles and data are still unaware of the degree to which information society depends on textile technology. When we choose textiles as a medium, we have an opportunity to highlight that connection.
Artistic data physicalizations are laborious, and they’re not immediate enough for many of the ways we use data. Still, I am drawn to the ways textiles can make associative leaps and humanize data: as if by giving data a body, we glimpse its soul.
Learn more about gendered labor, textiles, and the 1969 moon landing:
- Skilled seamstresses sewed Neil Armstrong’s space suit by hand, using techniques adapted from lingerie construction.
- A workforce of unnamed women, some of whom were retired or laid-off textile workers, hand wove the space shuttle’s navigation program.
- A workforce comprised mostly of Diné (Navajo) women fabricated the microchips for Apollo 11.

India Johnson is an Iowa City-based artist who makes sculptures, installations, and participatory projects for churches and libraries. Her work associates textiles with formal practices for organizing information. India received her MFA from the University of Iowa Center for the Book in 2020 and is a founding member of LGBTQ Iowa Archives and Library. India’s current project, "Thread Library," is a mobile exhibition which tours public libraries in the state of Iowa.
- India Johnson

- India Johnson


