
This article is part IV in a series on data exploration, and the common struggles that we all face when trying to learn something new. The previous articles can be found here, here, and here. I’m exploring the tools data from the State of the Industry Survey, to illustrate both how I approach a new project, and the fact that no “expert” is immune from the challenges and setbacks of learning. In addition to working with a new dataset, I am also using this project to take my first steps toward learning R. Let’s see where this journey takes us!
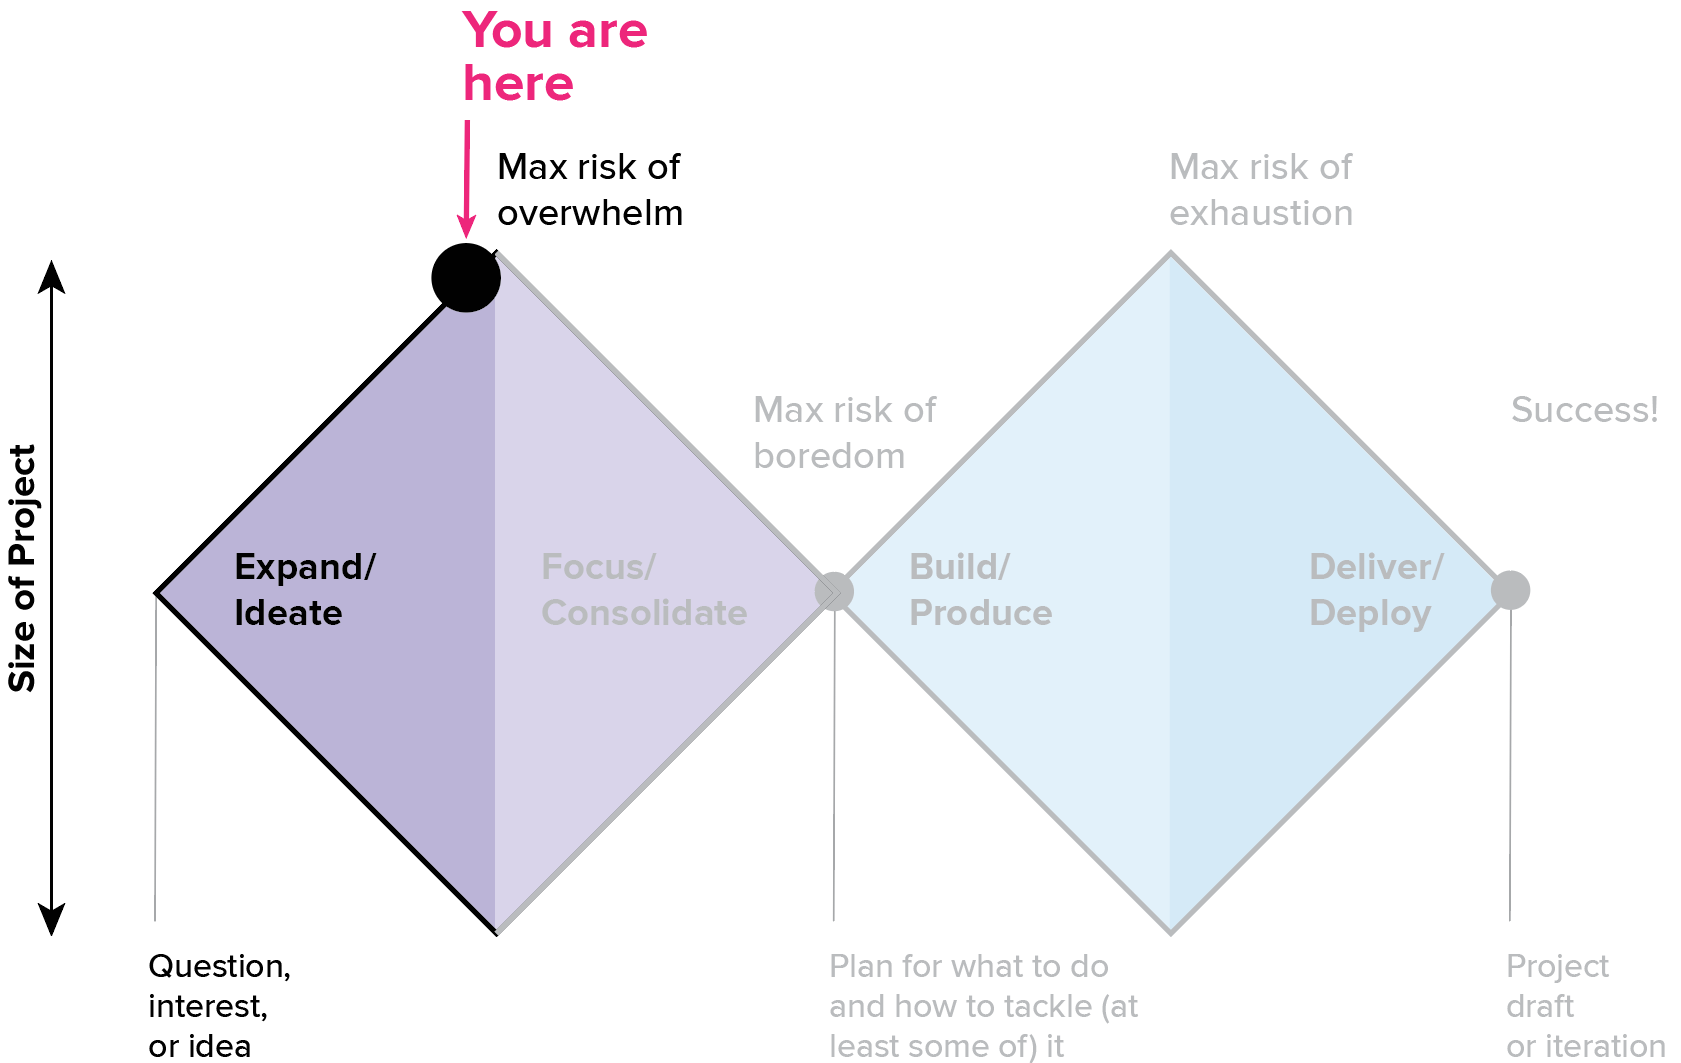
Last time, we got deeper into the details of the survey data to better define the kinds of questions it might be able to answer. At this point, I’ve exhausted most of the basic analyses in Excel, and I’m pretty sure that a more complex analysis (and possibly a more powerful tool) is necessary. I’m not sure yet how I want to structure that approach, but spending more time on the same methods is not likely to create additional progress at this point. I am getting ready to switch back into focus mode and engage with the harder problem of doing the analysis in an unfamiliar tool, but my instinct is telling me that there is more to see here before I move on.
The risk in this stage of a project is that I’ll stay in expand mode for too long, and my focus will collapse like over-proofed dough.

At this point, I need to make a judgment call about whether to keep expanding or switch into focus mode. For this project, I am indulging my interest in exploration a lot more than I would for something at work or on a strict deadline. This is an early-stage, conceptual exploration of a much larger project, and it’s worth investing some time in the big picture to help inform where we’re going. The tools analysis is actually outside of the scope of my core project deliverables, but I’m using this side exploration as a way to spend more time on a volunteer project, while also building some professional skills (understanding analysis in R).
When to follow a tangent
- When it feels exciting. There is a certain kind of excitement that comes from figuring things out. If the tangent is drawing you in, it might be worth a look. It’s important that this is not just about “shiny.” There should be at least a reasonably good chance that this tangent holds the key to understanding something larger. If your challenge is having too many distractions (mine isn’t), then you might want to be stricter about how you define this.
- When I’m blocked and want an interrupt or new perspective. Tangents can be a great way to keep moving without burning out. Sometimes an hour exploring a new idea is exactly the break that you need.
- When there is something that I will learn from doing it. Sometimes it’s worth pushing a little longer or a little harder if it will teach you an important skill, or if you will learn something about the project from following your nose.
- When I can leverage the tangent to keep me engaged. My most productive progress often happens when I’m deeply engaged with the project, but not actively thinking about it. Sometimes I take a walk and think about the problem at a higher level. Sometimes I read a book that I’m interested in that is related to my topic in some indirect way. Sometimes I try a different method or tool to see what perspective that brings.
- When my subconscious creates an unexpected or improbable connection. Every once in a while, my brain tosses out a connection or an analogy that feels intriguing and important, but that also makes no sense. It’s worth observing how you describe the problem to yourself, and the references you use when deep in the throes of a problem: they are often windows into connections that you haven’t seen yet.
In this phase of the project, I trust what my intuition tells me, unless I have reason not to. I have spent years honing my mind to solve problems. When my experience suggests that there’s something here to look at, I’ll trust its instructions, even if the logical part of my brain doesn’t necessarily agree. It’s important to validate your other ways of knowing, and to observe what you learn. If you are uncomfortable with this, the following tips might help.
Creating a safe space for exploration
Part of developing experience is creating a safe space for exploration. It would be a mistake to do your first hike as a solo backcountry trip in Denali National Park in Alaska. That’s not only foolish, but dangerous. If you want to learn how to orient yourself alone in the woods, pick a small state park with roads on all sides, and preferably one without dangerous animals in it. Similarly, it can be helpful to create some general parameters to define your tangent before going in:
- Work for five minutes, or an hour
- Pick a small problem, and start with that. (The tools analysis has plenty in it, but it’s actually just a small piece of the bigger project.)
- Give yourself time
- Don’t commit to deliverables
- Have a backup plan, in case you come up empty
- Don’t stake your professional reputation, your self esteem, your ability to deliver, or your social standing on getting it right
- If it helps you, don’t tell anyone until it’s ready (but don’t keep it to yourself so long that you smother it, either)
- Set low expectations
- Embrace the process, rather than craving the achievement. Let the process become the achievement.
- Pay attention to how you frame things. Sometimes we freak out about being “hopelessly lost” in the woods, when someone else would simply say that we took a wrong turn or that we’re on an adventure. The difference is perspective…and having smart protections in place.
Coming back to the survey data
While working through the analysis, I kept finding myself reaching for metaphors that create temporary states out of an underlying structure: gathers in fabric, notes on a piano, weaving cloth. I did several freewriting sessions where I tried to describe the problem, just talking myself through what I was trying to solve. I wasn’t looking for answers here, just insight into what connections I needed to make, and what they might mean.
I spent a couple of hours toying with an embroidery project, using patterned gathers (selections) to create structures.

I thought about networks, and connecting individual data points using beads. Networks also create the intriguing possibility of abandoning the grid entirely, though I kept it in this sketch.

Adding beads to the gathers also raises questions about intersecting layers of data. Connecting data points from different directions could highlight additional features of the structure. Each combination of strings will gather the fabric in entirely different ways.

I also played around with constructing the fabric itself, planning out a weaving project as a way to think through how different variables interact. I had planned to do a weaving project anyway, but selected this particular pattern because it would help me to stay engaged with the survey work, while also creating a gift for my aunt. This is an example of converting a project in a different part of my life into a tangent connected to this project, so that they worked together to move me ahead.

Weaving is a great way of thinking through sequences of structured patterns, and working through this project in a familiar medium helped me to get a better grasp on how to approach code in R. R is a functional language, which means that you take an input (a data table) and apply a series of operations and transformations to it in sequence as you execute different functions to get to a result. This is very different from the object-oriented programming that I’m used to in Javascript/d3, but it’s actually quite similar to what you do at the loom: one thread goes through multiple patterned structures to create the specific combination required to create a “shed,” and then a new thread is added to the cloth to lock the pattern in place. Drawing up a weaving draft is itself an exercise in visualization, and it also helped me to think through the project as a sequence of steps (functions) applied to an individual thread (data row).

The most interesting insight (to me) from this exercise is that the fabric itself is actually a record of the sequence of analyses applied, rather than the data points themselves. You can weave many patterns from a single set of structures, just by applying your functions in a different sequence. Working through this project with physical materials gave me a concrete way to think about the features that I was struggling to understand in the more abstract world of code.

I also started to extend the weaving metaphor to think about what it might look like if I tried to actually convert this dataset to a woven piece. It’s highly unlikely that I will actually do this, but working from a language that I understood helped me to see what relationships I was trying to create in the dataset, and helped me to find some contradictions that I hadn’t resolved.
It’s also worth noting that I am leveraging materials and techniques that have long been dismissed as “hobbies” or “women’s work.” Respecting these other ways of knowing often creates insights that you might not otherwise see, and can be an important advantage when you’re looking for a creative solution. It’s easy to dismiss other experiences or approaches as “not really data vis,” but if you have a tool in your toolbox, there’s no reason that you can’t apply it to solve the problem at hand. These different perspectives often contain the insights that will help you get to a better solution. There’s no need to restrict yourself to methods that others understand or value when you are exploring to meet your own needs.
For all of these reasons, I consider tangents like this to be a highly productive diversion from the core work of my project. They did take me a little bit outside of the bounds of what I needed to do, but they only took a few hours, and they helped me to enjoy the process and stay with the expansion a little longer while I worked things out. I also accomplished some useful things:
- Trained my intuition. This project is less about the fabric or the folds themselves, and more about the structured threads that create the patterns that I want. I suspect that my final analysis of the data will be more about patterns created by capturing temporary states, and less about drawing out the data itself. I’m not sure precisely what this means yet, but I know that it’s important. This exploration has made it more likely that I’ll recognize what I need when I find it.
- Built a dictionary of metaphors. Different ways of structuring the analysis give me different hooks to use when looking for patterns. Threads create one kind of gather, beads create another, and weaving uses the “gathers” in threads on the loom as a method to build the cloth itself. These different metaphors help me to look at the problem in different ways, and I can use them to think through the problem as I get deeper into the weeds.
- Indulged my curiosity. Curiosity is one of the most powerful motivators. It’s easy to forget, but nurturing your sense of discovery is one of the best ways to keep excited about a project and avoid burnout. It never hurts to put a little wind in your sails before settling in for the long haul.
- Took a rest and built stamina. My number one reason for using tangents is to stay engaged with a project while doing something else. A full break is rarely productive for me. It’s too easy to forget where I was and what I was doing, and it makes a huge barrier to entry when I want to come back into the project. Switching gears and using a different part of my brain helps me to keep active, excited, and in touch with the project, while also creating a space where I can rest a bit before digging into the real work that lies ahead.

Erica Gunn is a data visualization designer at one of the largest clinical trial data companies in the world. She creates information ecosystems that help clients to understand their data better and to access it in more intuitive and useful ways. She received her MFA in information design from Northeastern University in 2017. In a previous life, Erica was a research scientist and college chemistry professor. You can connect with her on Twitter @EricaGunn.
- Erica Gunn

- Erica Gunn

- Erica Gunn

- Erica Gunn


