
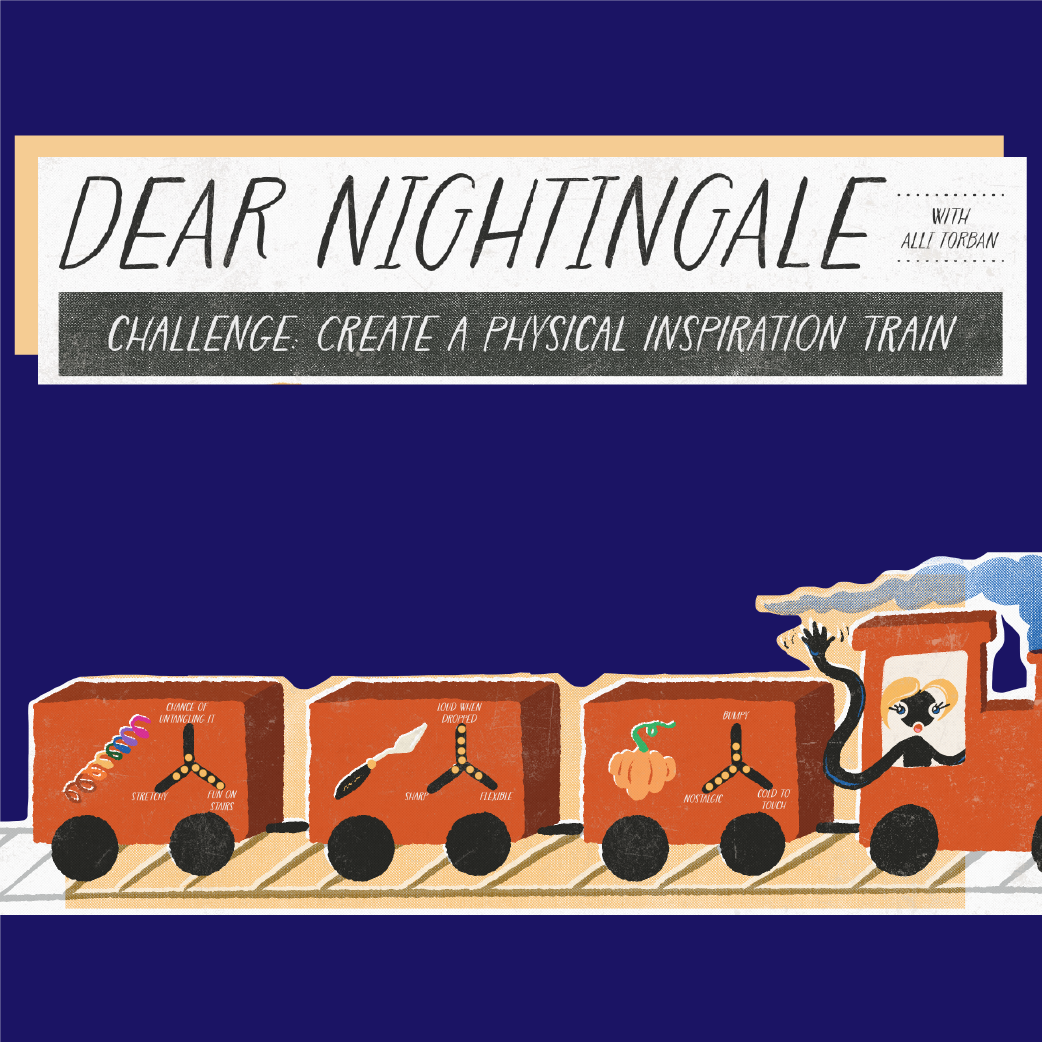
This edition of the Dear Nightingale analogue data visualization challenge, hosted by Alli Torban, prompted readers to create a “physical inspiration train” by finding three physical objects and quantifying their attributes in radar charts. Check out the submissions:
Winnie Poel: Some days it feels like the things that kids collect and create are taking over every corner of the apartment while I am trying my best not to notice them anymore. For my inspiration train I did the opposite. First, I picked up a joyful little Lego figure that confidently defies the gender stereotypes so commonly found in kids’ toys. Next, there is a spring-like object crafted from strips of paper. Its texture intrigued me because it is crisp, geometric and stiff like thick paper while at the same time bouncy and slightly irregular, which gives it a more organic feel. My favorite find however is the squishy, slimy, (and also quite dusty and hairy) yellow object that was hiding in the couch. It is one of these things that kids just love and most adults find irritating at best. It reminds me of how our perception changes with age.

Annette Hexelschneider: My inspiration train carries items I have had for some time. The oldest item is my heart (sic). Sadly so it is normally out of my sight in a drawer… I made the WILL letters from papier mâché leftovers. Fun fact: This word works in German and English. And you can use it with many meanings. The letters sit on a place next to my desk, hence their active reminding quality. In the notebook I use frames for wise words I encounter together with sketches. This train can be a fun thought starter/warm-up/way out of being stuck before/when I dataviz. Either with the current items, with the same or perhaps new attributes or with different items. Moreover the combination of these attributes may guide you to achieve more with your visualizations. Imagine a data visualization that is at the same time adventurous and thoughtful!

Caroline Doyé: My view of everyday objects and nature’s gems has always been a source of inspiration and creative thinking. I have chosen three objects within reach without much thought. I realize when choosing my categories that I am guided by having a child. It makes me chuckle that the angel can at most fly (drop) down if someone bumps against it and still hope that this never happens. But the angel also triggers wonderful memories when I touch and look at it. The pine cone is one of the many gems I like to collect along the way. It holds secrets and defends them with its teeth, which reveal themselves when drying. The pacifier somehow looks like a UFO. But it doesn’t fly through the air so elegantly. As an object for babies, it reminds me that so many possibilities are open. For me, all these objects stand for well-being and good (childhood) memories.

Daleen Rabe: When I immigrated four years ago, I owned one suitcase full of items. Since then I have slowly built up my life. Again. Through this experience, I have learned that the real value in objects is the dreams and memories we connect to them. Not their monetary value, utility or aesthetics. Over the years I (re)gained all three of these items. The plant (on the left) was the first one I bought. He has been by my side for all these years and blooms with me every year. The least valuable item, is the most expensive and beautiful item, an antique porcelain creamer filled with someone else’s memories (in the middle). And the most valuable to me is the smallest of them all, my great-grandmother’s thimble. Worn down but also a connection to my roots.

AmberLee Fawson: I read about the Dear Nightingale challenge the day before I left on vacation. So I grabbed a sponge brush, paint, and some clearance t-shirts and packed them in my luggage. For the data challenge, I took some vacation liberties: instead of collecting things around my home, I approached three strangers vacationing at the same place that I was and asked them for self-reported attributes.

Kate Miller: Scouring my home office, I happened upon a wooden fish from an artist’s market somewhere in Latin America, a CD my friend burned and gifted me circa 2005 and a rose quartz face roller. After poking and assessing each one for some time, I challenged myself to find three attributes on which I could evaluate all the objects. I landed on the following: each affects the five senses differently, I still have for different reasons, and were produced through different means. So my radar graphs (1) order which senses are affected most to least, and identify where on the scale each sits between (2) practical v. nostalgic and (3) hand v. machine. While it seems like a simple exercise, I found it oddly difficult to decide if a CD is 50/50 made by hand and machine or if I am more likely to smell than taste a face roller.

Eden Ehm: I crafted my physical inspiration train from unexpected items I could see from my home office desk: space pen, eye cream, and crystal. Initially, my total lack of creativity in quantifying the objects’ attributes was concerning. However, once the creative juices were flowing it was hard to decide on just three attributes to plot! Whether it was rainbow potential or the ability to write in space, I focused on what I found most fun, interesting, and unique about each object. This challenge also renewed my interest in radar charts. I find the funky angles, triangles, and spikes they produce visually interesting, drawing me in to look closer at visualization. I am excited to challenge myself to use them more in my work and personal projects.

Nightingale Editors
Our Nightingale editorial team currently consists of Alejandra Arevalo, Brian Cort, and Teo Popescu. Reach us at Nightingale(at)Datavisualizationsociety.org
- Nightingale Editors

- Nightingale Editors

- Nightingale Editors

- Nightingale Editors


