
We find Cosmology in the large among sacred and political monuments. Information about our origins and our place in the universe is also encoded in portable artifacts. Information designers have distilled cosmology into symbolic patterns that can be reproduced in a variety of scales. A small collection of symbols, scratched, painted or printed on a recording surface can represent an entire cosmology, realizing the same information value as the monumental painted surfaces and stone façades presented in Part 2 of this series.
In this part, I will start by examining two examples from the Americas — one from Mesoamerica and the other from the Great Lakes region — that illustrate cosmology and provide a bridge to several of the other themes such as maps, transportation diagrams, and timelines.
The Aztec Migration Map
The Sigüenza Map was painted by a Mesoamerican artist for a noble Aztec family. It represents the journey of the Aztecs from their origin in Aztlan across northern Mexico to Tenochtitlan, in present-day Mexico City. The image is painted on a single sheet of native paper. It is one of many Aztec and Mixtec visual records that demonstrate how Mesoamericans used a combination of drawing, pictograms, numerical, and ideographic writing to record spiritual and historical events [1]. It’s Spanish name refers to Carlos de Sigüenza y Góngora, a 17th-century historian and poet who received it from a descendant of the Aztec ruling family.

The composition begins as a travel itinerary. In the upper right corner of the page, a deity in the form of a white bird instructs the Aztecs to begin their journey from Aztlan. Fifteen male figures set off on a path punctuated by footprints to indicate direction. Three-quarters of the page is covered by a winding path connecting a sequence of locations. For each place, there are symbols for a name and a number indicating the years spent at that location. Phonetic script spells out the Nahuatl name for some locations, presumably an addition made after the Spanish conquest.

The path records a directional movement and duration of time from one location to the next. The sequence is recorded with no concern for the relative geographical position of the locations. Then in the lower left of the page, the composition changes. As the Aztecs approach the Valley of Mexico, the design is dominated by a mountain representing Chapultepec, the sight of a battle the Aztecs lost against other groups already in the valley. Here the information design goes through several transformations. The path splits into three paths. The orientation of the figures rotates. We can speculate that the viewer would turn the paper 180 degrees to read the conclusion of the narrative. Now the places on the itinerary around the Valley of Mexico are located in geographic space, marsh grass surrounding blue water lines of channels and lakes, with the site of Tenochtitlan marked by a circle at the crossing of the channels.

A recent study of this and other Aztec and Mixtec pictorial histories provides a useful explanation for this shift from one form of representation to another [2]. The design communicates what is important by first using an itinerary system in the first part of the diagram to emphasize the sequence over the location. It then switches to a system of geographic relationships. The geographic locations of the places are omitted because they are unimportant until the Aztecs arrive in the Valley of Mexico. Once in the valley, the location of lakeside towns was critical to the story of how the Aztecs rose to power. The Aztecs enter the valley from Chapultepec, moving west to east [3].

This combination of visual strategies within a single composition illustrates how the most important value being encoding drives the overall composition.
The Ojibway Migration Chart
Another example that combines spiritual narrative and geographic reference is the Ojibway Migration Chart, whose format is literally shaped by its materials, a set of six birch bark panels stitched together to present a unified narrative. These birch scrolls were rolled for storage and transport, then unrolled during ceremonies as mnemonic aids for oral performance and transmission.
This image was traced in the 1960s by Selwyn Dewdney, a Canadian writer and artist, from a scroll that belonged to James Red Sky Senior, an Ojibway living on the Canadian side of the Minnesota-Ontario lakes region. Dewdney published his tracing rather than photographing the original, perhaps because a photo reproduction of the birchbark would have been far less clear. [4, pp. 62–63] The scroll tells the story of the Ojibway migration from the salt ocean through the Great Lakes region to a location in northern Minnesota named Leech Lake. The group’s present location is the end of the scroll on the left. Time moves from the east on the right, where the story begins, to the west on the left, where the people currently live.

The same migration story has come down to us in many sources. It was written into an Ojibwe history by Warren in the mid-19th century [5], and Dewdney documents two other scrolls in 20th-century museum collections [4]. Focusing on the information design strategy, we can see that the overall design records the actions of the spirits at locations, using pictograms to represent specific spirits and lines to represent geographic locations. Many of the pictogram symbols, read as animals, have significance both as members of the spirit world and as clan ancestors. The places around them are read as specific landmarks along the Gulf of St. Lawrence River and the Lake Superior watershed.

Like the Aztec migration map, we can read this narrative as a combination of sequential itinerary and geography. Overlaying the design on a regional map can help a modern audience see the content by showing which lines correspond to modern landmarks such as the French River, Sault Ste. Marie, Fond du Lac, or the headwaters of the Mississippi River, places whose shapes do not correspond to our expectations from reading contemporary maps. But comparing the diagram to a contemporary map emphasizes what the design is not. This cosmology was not designed to be a set of literal travel instructions. Its visual sequence is a spiritual journey connecting the present world (Leech Lake) to the past time and place where the people received instructions from a spirit ancestor (the Bear) to honor the Creator. It is a document that recounts a journey in order to locate a spiritual tradition in the present.
Nodes and Links of Creation
These examples show how the structure of cosmology can be represented through an accumulation of representation and symbols. We can also find examples that rely on the visual organization of textual elements and symbolic abstraction. Jewish theology has a long tradition of representing sacred ideas only in text and oral performance. Ritual objects, symbols, and sacred texts are revered, but the cosmology in these texts are rarely presented in visual form.
An exception to this is the visual representation of the sefirot (emanations) associated with Kabbalah, the Jewish mystical tradition. It is difficult to identify the origins of this tradition, but one of the earliest versions in a printed book is attributed to Moses Cordovero, an interpreter of mystical Judaic thought based in Ottoman Syria in the 16th century. The diagram appears in its most simple and abstract form in Pardes Rimonim (An Orchard of Pomegranates) [6], a book in which Cordovero summarizes the main trends of mystical thought that had been handed down as oral tradition through Jewish communities in Muslim Spain.

This diagram is symmetrical, though the hand of the engraver has created small variations in the angles that connect the nodes. The arrangement of the nodes consists of four on a central axis and three each on the left and the right. Each of the ten nodes has three to eight connections to other nodes, for a total of thirty-two pathways. The diagram presents a powerful visual pattern that supports an enormous variety of interpretations and elaborations.
The sequence begins at the top of the diagram and proceeding downward. Eight emanations — Wisdom, Understanding, Love, Judgment along with the Supreme Crown — flow into the central node of Beauty, which in turn flows into Lasting Endurance, Glory, and Foundation, all of which flow into Kingdom. I selected this image from Pardes Rimonim because it is one of the oldest but also because it differs in an important way from contemporary link-node patterns. The interconnections here are lattice-like and the nodes are not closed. The circles containing the sefirot appear open to the channels through which the emanations flow into and through each other. In some accounts, the pattern represents the Tree of Life, a phrase that is also the Hebrew name of the sacred Torah scroll. It is often interpreted as an inverted tree, growing from top to bottom [7].
The Art of Finding the Truth
Ars inventiva Veritatis (The Art of Finding the Truth) is another inspiring example of theological abstraction. Its designer, Ramon Llull, came from 13th-century Majorca, an island with Moslem, Jewish, and Christian populations that had recently been absorbed into the Aragon Christian kingdom. Llull grew up in the luxury of the royal court, then experienced a mid-life mystical conversion. The rest of his life was devoted to converting non-Christian populations to his one-true faith, establishing schools to teach his ideas and writing an enormous number of books. To support his mission, Llull educated himself in Arabic and Latin, as well as his native Catalan, and traveled extensively in Europe and North Africa. He absorbed many contemporary influences — the work of Thomas Aquinas, who argued that reason is found in God, the Jewish Kabbalah from Muslim Spain, the Arabic humoral medicine tradition and Christian Neo-Platonism. In order to convince a Moslem and Jewish audience of “the truth”, he developed a form of logic based on what he saw as common ground among the three religious traditions [8].

Llull’s circle diagrams, hand-drawn in manuscripts and later engraved in printed books, have led many commentators to see his work as a precursor to symbolic logic and computer science. These same diagrams may have been implemented as volvelles, circular layers of paper or parchment that the reader could manipulate to create different ‘solutions’ to a question [9]. In its simplest form, the Art is based on nine ‘dignities’: Goodness, Greatness, Eternity, Power, Wisdom, Will, Virtue, Truth and Glory. The Latin words for these principles sometimes appear in diagrams, but more often Llull reduced them to individual letters — BCDEFGHIK — to make combinations based on abstract patterns easier to produce and visualize. The first-order wheel is combined with second-, third-, and fourth-order wheels to create large numbers of combinatorial patterns. The resulting visual patterns are fascinating in their regularity and complexity. We see similar patterns appearing in data-driven visualizations today.
Creation in the Nuremberg Chronicles
The representation of the seven days of creation in the Nuremberg Chronicle provides an instructive bridge between the pure abstraction in Llull’s cosmology and the broader Christian representational tradition of transmitting theological concepts in the form of narrative drawings. The Nuremberg Chronicle, also known by its German title Weltchronik (World History), is a description of the known world from creation to the present, written by the 15th-century humanist Hartmann Schedel [10]. It was published in Nuremberg in 1493, a few decades after printing with moveable type had been introduced by Guttenberg in nearby Mainz. The new technology permitted the production of many copies of the book, after which each block print page was then hand-colored.

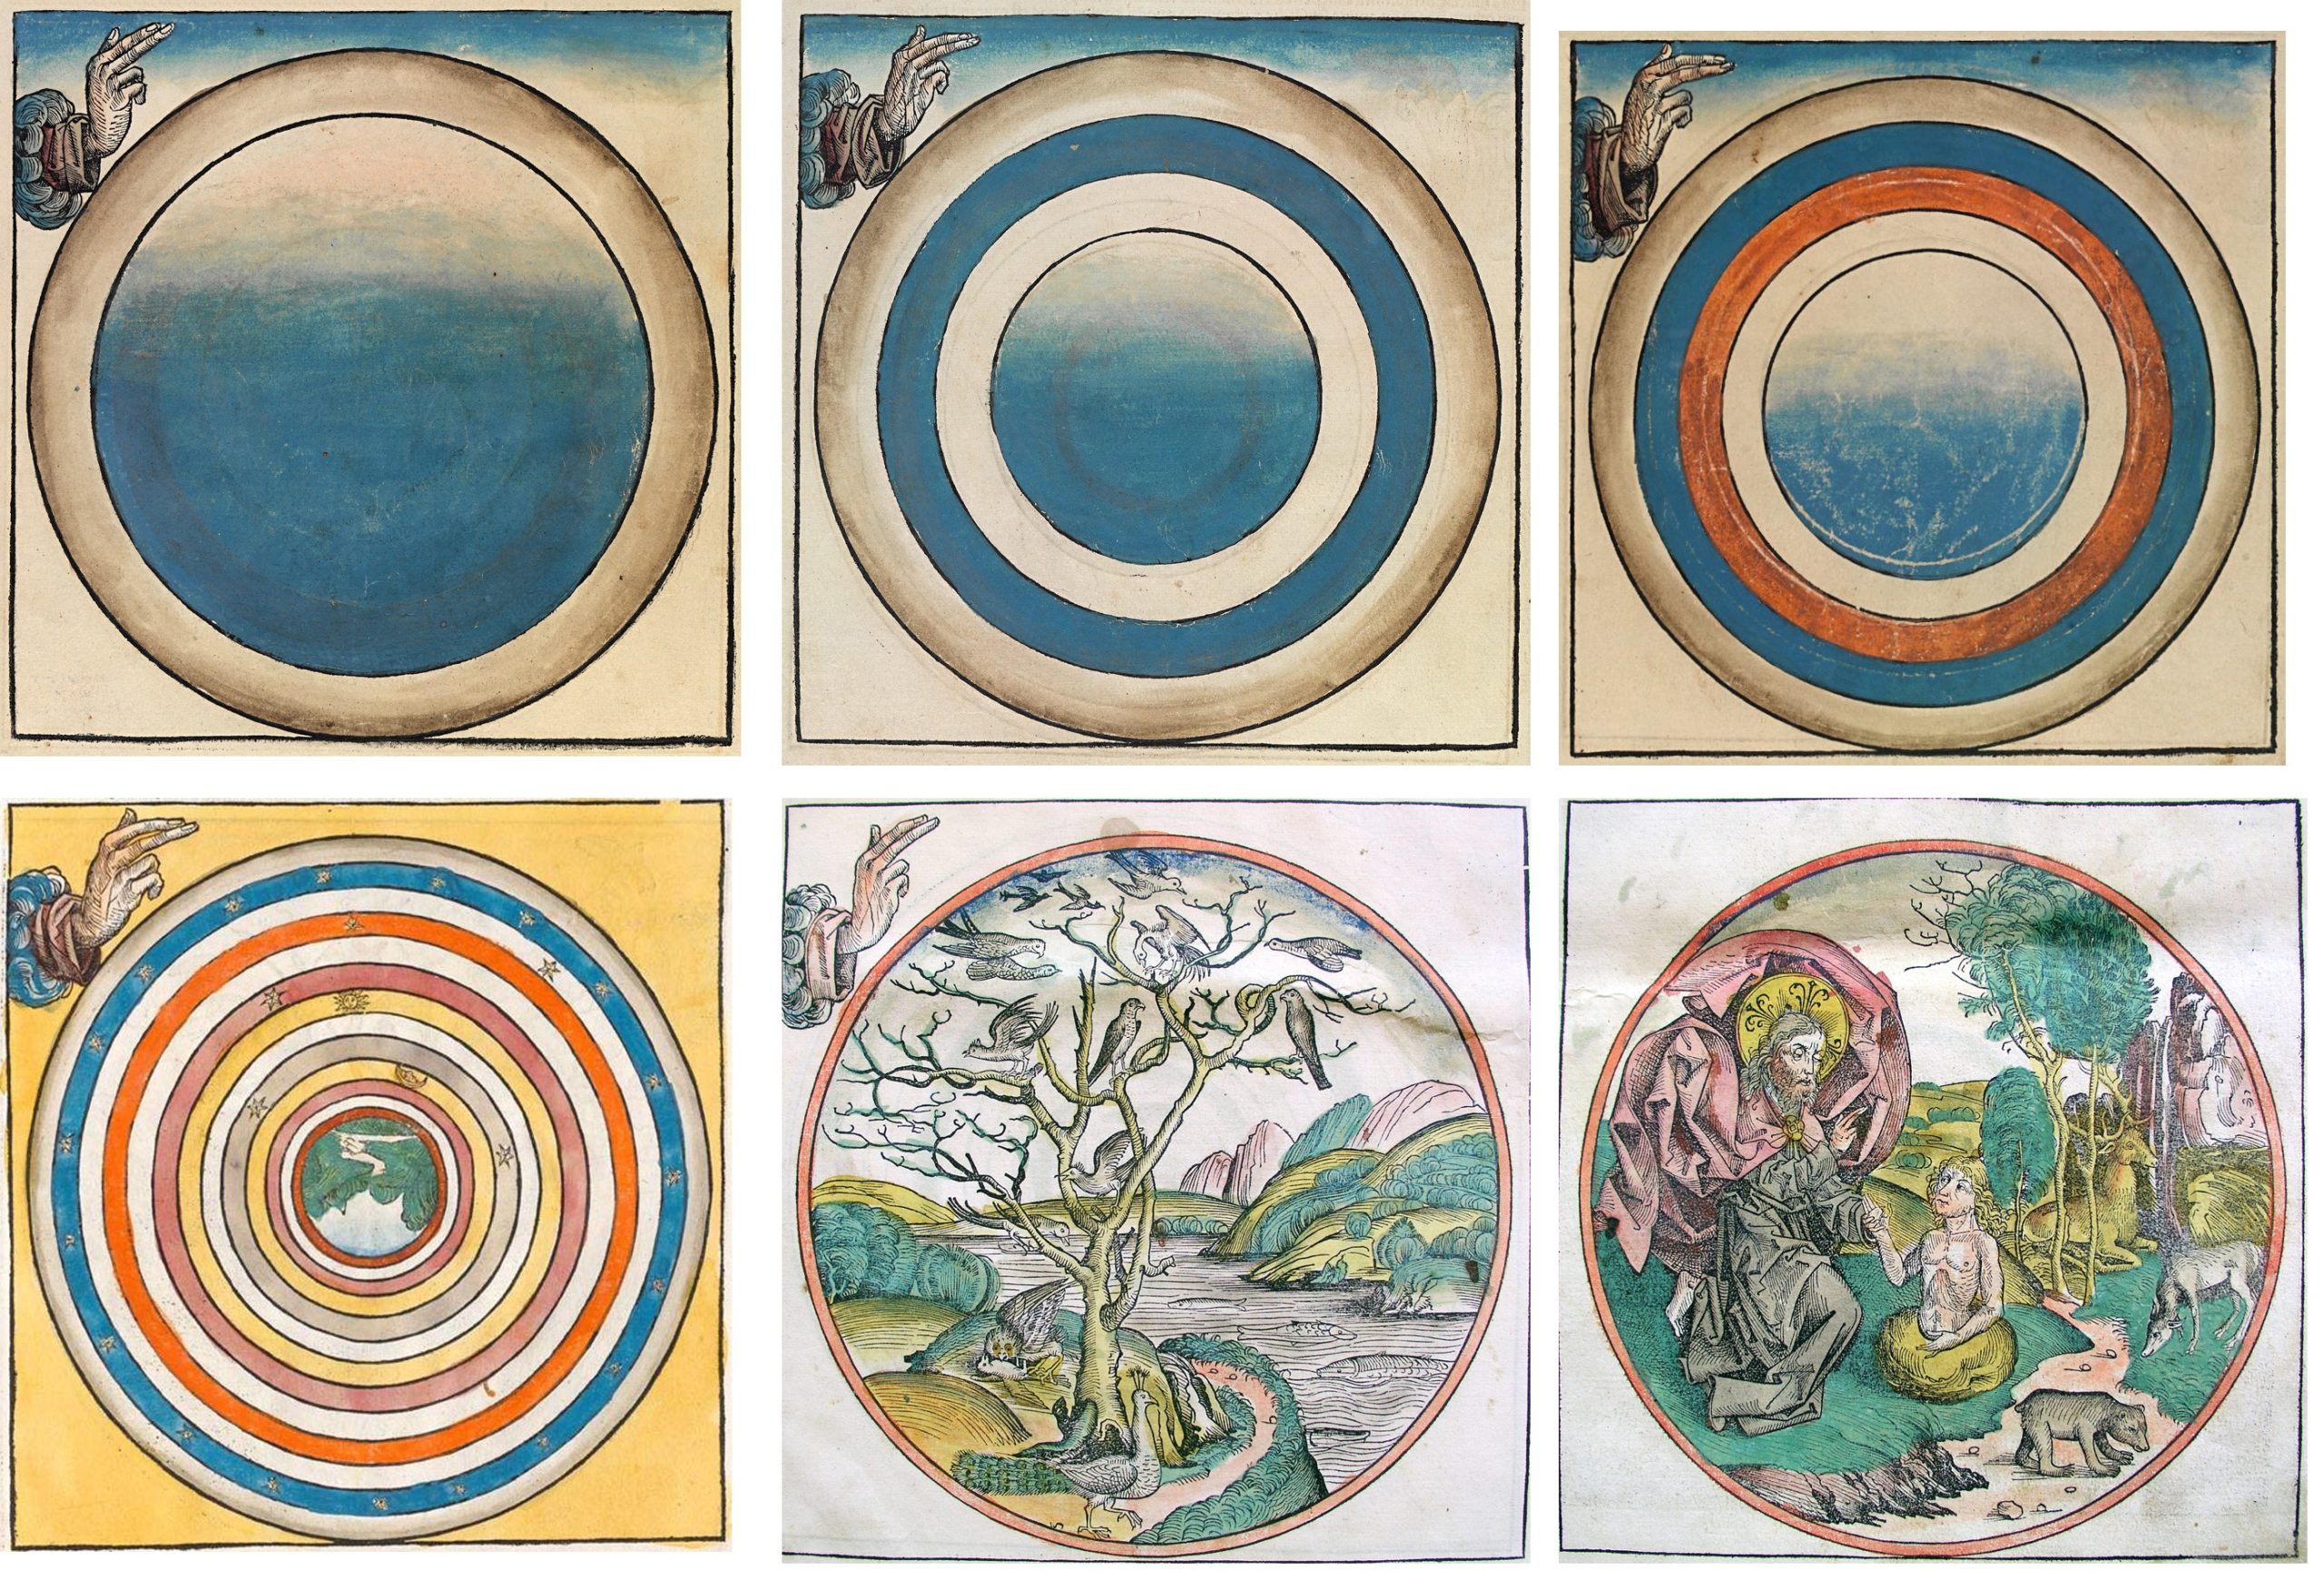
The illustrations for the first four days of creation are strikingly abstract. The first day is a single ring of space enclosed by two circles. In the upper left-hand corner is a hand emerging from a sleeve, emerging from a cloud. This disembodied hand represents the Christian deity, but we will see it reemerge again and again for centuries, representing the vector of action within a diagram. For this first day, the colored versions of the circle blend from white to blue to represent the separation of light and dark. The second day adds two internal rings to represent the separation of the sky and the earth. The third day now has four rings representing earth, water, fire, and ice. The fourth day extends the concentric rings to thirteen, representing zones for the planets and the zodiac filled only by symbols for the stars, the moon, and the sun. The center is now a river landscape, inverted to convey the rotation of the earth [10].
When we turn to the fifth day, the representational earth expands to fill the entire circle. Birds appear flying, strutting, mating and consuming each other while fish swim in the sea. The hand of the deity still gestures outside the ring of the universe. But for the creation of the animals and man on the six-day, the deity moves inside creation’s circle. That same hand raised in benediction is now connected to a robed and haloed deity with a body, while the other hand draws man from the earth.

For the illustration of the seventh day, the abstraction and representations are combined. As the deity is now inside the ring, the hand is gone, replaced by faces of the four winds occupying the corners. The outer ring now contains the deity and angels. The earth and the thirteen concentric rings that surround it remain as abstract code, now reduced inside the circle of the deity and angels. The rings are labeled for the four elements, the visible planets, moon and sun, the ring of the zodiac enclosed by two outer rings labeled as the crystal ceiling and the primal force that keeps the universe in motion.
These are seven of over 1,800 woodblock prints created by Michael Wolgemut’s workshop, where the young Albrecht Dürer served as an engraver’s apprentice. The faces of the four winds surrounding creation are nearly identical to the four winds above the angels in Dürer’s engravings of the Apocalypse published six years later [11].
Next: Maps, Beginning with the Known World
I have noted how several Cosmology examples resemble maps, but Cosmology and Maps serve entirely separate functions. Maps, our second theme, are information designs that locate things we can touch and see — man-made structures, rivers, roads, lakes — in relation to one another. They are visual summaries of our knowledge of the known world, our kingdom or our city. Next, we will dive into Maps, beginning with the known world.
Global Information Design: an overview of the series
Global information design embraces the visualizations of both qualitative data such as expressions of social hierarchy, cultural beliefs, and values, and quantitative data, such as economic trends and scientific explanation. We can broaden our view of information design by following the pathways of its intended use. Exploring the history of how we visualize cosmology and timelines, transportation networks and family lineage, is as informative for current data visualization practice as the mastery of programming libraries and cognitive science. Studying examples of information design from many time periods and many cultures helps us understand how we shape patterns of difference into hierarchies and networks to create that chart, story, or graphic from the patterns that connect.
Bibliography
[1] C. de Sigüenza y Góngora (collector), “Mapa de Sigüenza,” Mexicana, Cultura, Direccion General de Tecnologias de la Informacion y Comunicaciones, México, 16th century.
[2] E. H. Boone, Stories in red and black: pictorial histories of the Aztecs and Mixtecs. University of Texas Press, 2000.
[3] D. Leibsohn, “Colony and Cartography: Shifting Signs on Indigenous Maps of New Spain,” in Reframing the Renaissance: visual culture in Europe and Latin America, 1450–1650, C. J. Farago, Ed. New Haven: Yale University Press, 1995.
[4] S. H. Dewdney, The sacred scrolls of the southern Ojibway. Toronto ; Buffalo: Published for the Glenbow-Alberta Institute, Calgary, Alberta by University of Toronto Press, 1975.
[5] W. W. Warren, History of the Ojibway people, Reprint ed. St. Paul: Minnesota Historical Society Press, 1984.
[6] M. ben J. Cordovero, Pardes rimonim. Lvov: Bi-defus Z.L. Fleḳir, 1862.
[7] C. Poncé, Kabbalah: an introduction and illumination for the world today, 1st Quest ed. Wheaton, Ill.: Theosophical PubHouse, 1978.
[8] R. Pring-Mill, “The Lullian ‘Art of Finding Truth’: A Medieval System of Enquiry,” Catalan Review, vol. 4, no. 1–2, pp. 55–74–74, 1990.
[9] R. Martin, “Decoding the Medieval Volvelle | The Getty Iris,” 23-Jul-2015. [Online]. Available: http://blogs.getty.edu/iris/decoding-the-medieval-volvelle/. [Accessed: 30-Oct-2018].
[10] H. Schedel and S. Fussel, Weltchronik, Kolorierte Gesamtausgabe von 1493. Köln: Taschen, 2001.
[11] A. Wilson, The making of the Nuremberg chronicle. Amsterdam: Nico Israel, 1977.
Thanks to Jason Forrest.

Paul Kahn’s engagement with visualization of large knowledge structures began with hypertext research projects in the 1980s and continued with the development of diagram techniques for describing information architecture. He taught Information Design History for 7 years at Northeastern University’s Information Design & Data Visualization program. He created Kahn+Assoc., the first agency in France focused on information architecture, preceded by a decade leading Dynamic Diagrams in Providence RI. He served as Experience Design Director at Mad*Pow and now devotes himself to teaching and writing in France. In 2020 he led Covid-19 Online Visualization Collection (COVIC), and has written about insights from the thousands of visualizations created during the pandemic.
- Paul Kahn

- Paul Kahn

- Paul Kahn

- Paul Kahn


