
Nightingale Magazine Issue 2 is now arriving in mailboxes around the world—we’ve already started to see excited posts on social media! (For those that are getting theirs now – don’t forget to share yours using #NightingaleInPrint.) Since it’s the beginning of a new year, I thought I’d reflect a bit and take you on a behind-the-scenes tour of Issue 2.
But before I get into it – let’s hear it for Mary Aviles!
I’d like to take a moment to give a heartfelt thank you to our former Managing Editor, Mary Aviles, who is leaving us to focus on her next chapter in work and life. To say that she has been an inspiration to us all is an understatement.

Mary has an amazing capacity for strategic high-level thinking as well as rolling up her sleeves to get the work done. As an editor, Mary has supported hundreds of authors of all skill levels over the last two years, and I have personally seen her nurture and guide them in a selfless way. I have been one of those writers as well, and I really enjoyed collaborating with her as an editor—she poked holes in weak statements, cleaned up details, and urged me to make my work more interesting, easier to read, and just better overall.
Nightingale – and the Data Visualization Society as a whole – is indebted to Mary for all that she has done to sustain our operations and encourage us to set our goals higher. She has been a champion of our focus on community, inclusion, diversity, and social engagement. She has driven multiple initiatives behind the scenes to support emerging voices and has worked to see individuals recognized for their contributions.
Mary helped us think of Nightingale as a community celebration—and, indeed, Issue 2 is bursting with ideas from and by our community. While we are excited to see what Mary gets up to next, we also consider Issue 2 to be a perfect manifestation of her impact on our team and community.
OK let’s get into it!
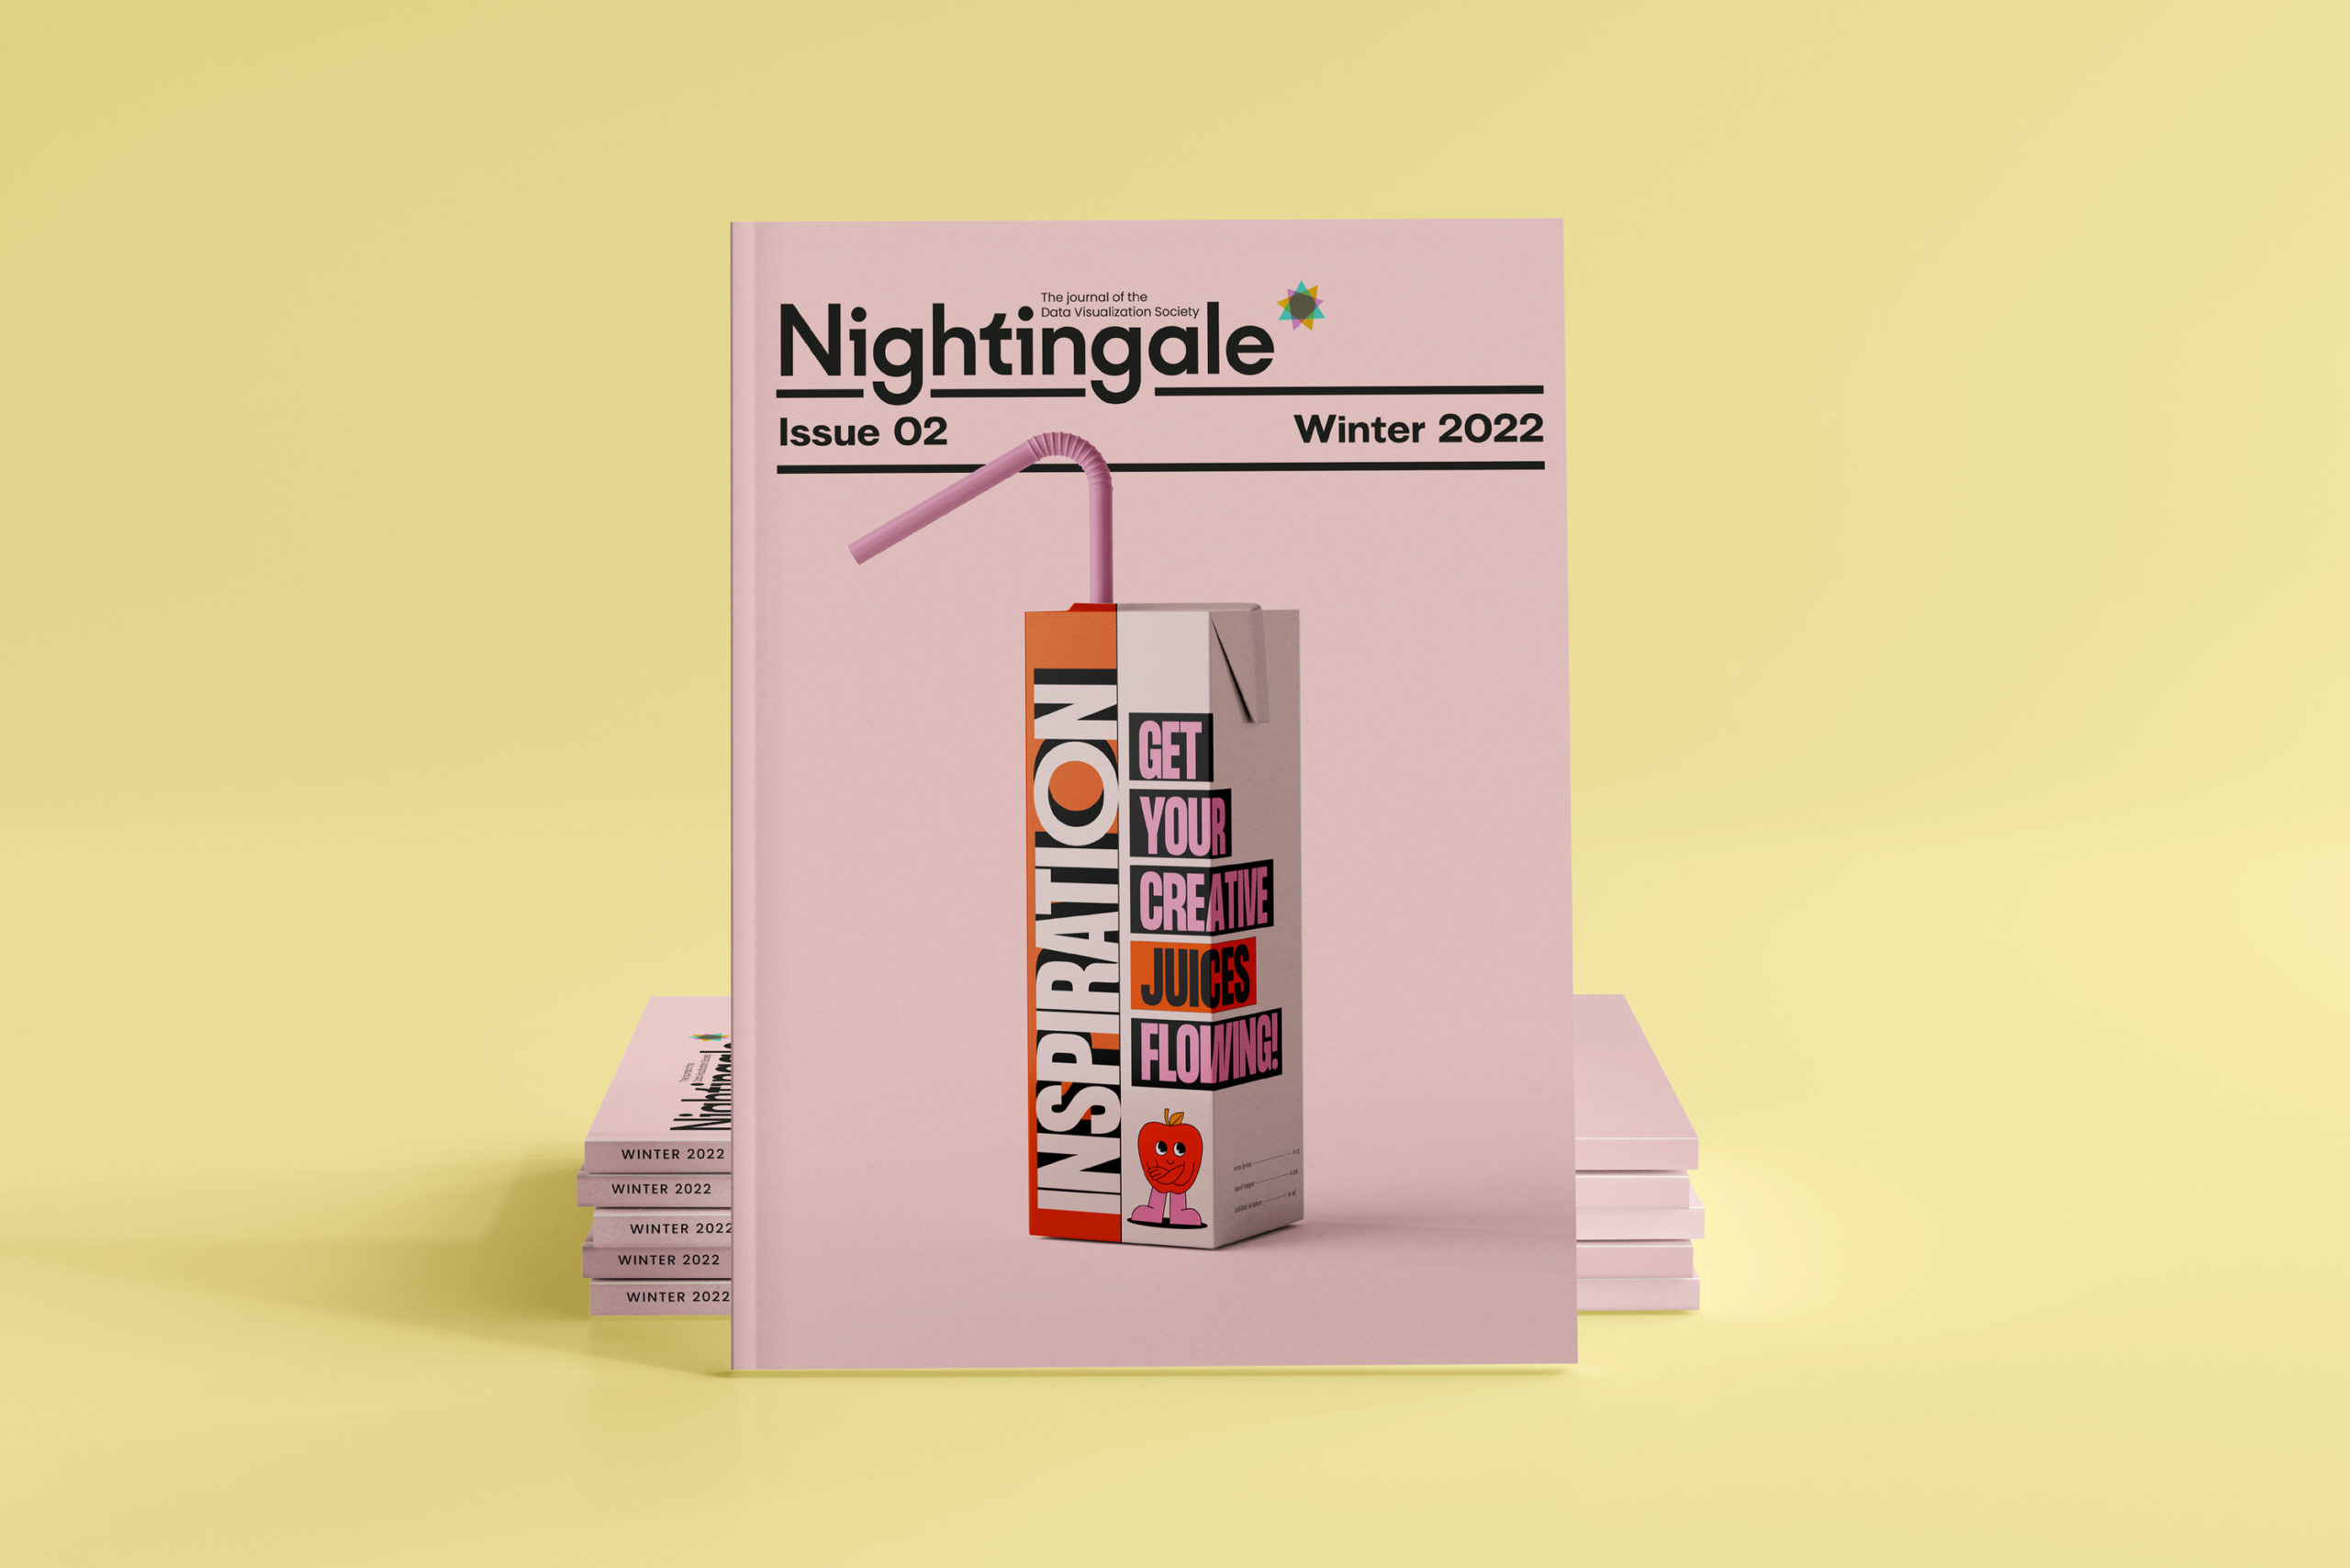
This issue is all about inspiration. It started with a conversation with our editorial committee a few weeks after Issue 1 came out. As you can see below, the committee shared MANY ideas; it’s interesting to look back and see what became reality, like the idea of inspiring climate action and a survey asking readers how they are inspired. Here’s our slide showing the sticky note brainstorm:

Indeed, the committee all agreed that we needed to start the issue with a survey to try to learn more about the who, what, when, where, and why of inspiration. We sent out a quick survey and received about 50 responses from people all around the world. Here’s a look at the spreadsheet:

After some clean-up, our Creative Director Julie Brunet (aka datacitron) took the text and data and had some fun with it. The issue opens with a few pages of some of the most exciting and non-traditional dataviz we’ve seen, as she turns survey responses into “scientific diagrams.”
This article culminates in an especially brilliant diagram charting the course of inspiration itself. Maybe we can get Julie to write a whole article about it because it’s so clever!

Here’s the Table of Contents for Issue 2. I hope it will whet your appetite not only for the names and concepts listed but for the types of articles contained inside:

In many ways, Issue 2 builds on what we believe were the strengths of the first issue. The astute reader will see a few more in-depth articles with a longer page count. Our editorial team also commissioned more original articles for Issue 2, in addition to reworking some digital content from our archives, and commissioned custom illustrations. Be sure to check out some of my personal favorites, the articles by Pilar Dibujito, Matthew Brehmer, Gary Wolf, Andy Kirk, Katie McCurdy, Joseph Mackereth, Andy Cotgreave, and Dee Williams & Rahul Bhargava. Ok, I guess I mean, just read them all! Haha

Our content editor, Claire Santoro, really outdid herself in exploring the inspirational qualities of Ed Hawkins’ Warming Stripes visualization, not only in evaluating the inspirational impact his work has had, but also in interviewing two practitioners who played key roles in the Warming Stripes’ origin story—Ellie Highwood, who created a Warming Stripes baby blanket, and Joan Sheldon, who created a Globally Warm scarf. It’s an amazing story of how inspiration fuels more inspiration, generating more positive energy for more people. If that weren’t enough—Chesca Kirkland created an amazing infographic charting the uses of the Warming Stripes and their continued influence. We’re so proud of this team for bringing you a story that you could only really find here in Nightingale!
Issue 2 also saw an extension of our Career Tooltips section, with a great article by Elijah Meeks (“Turn that No Into A Yes”) that I’m sure almost anyone working in dataviz will enjoy, commiserate with, and gain insights from. One of our former editors, Raeedah Wahid, shares some of her experience for early career folks in “7 Tips for Starting Out in Data Journalism.” We also featured a number of the career journey maps highlighted in the webinar/interview series Careers in Dataviz hosted by Elijah Meeks throughout 2022.
There are two excellent dataviz challenges in Issue 2—this time including the amazing submissions from Issue 1! Jeremy Singer-Vine continues his Data Is Plural challenge with a fun take on Bob Ross, while our friend Alli Torban takes the reins to host this issue’s Dear Nightingale challenge. As a fun bonus, we convinced the original Dear Nightingale hosts Stefanie Posavec and Giorgia Lupi to provide some commentary on the Issue 1 submissions.


But wait! There’s more!
This issue includes not 1… but 2 supplements! Since we heard so many enthusiastic comments from our readers on The Kids’ Table ‘zine from Issue 1, we decided to push it a bit further—this time it’s an activity poster! PLEASE send in your completed projects—we’d love to share some in Issue 3!
We are also excited to present “Unimaginable Death: Visualizations of COVID-19 Pandemic Milestones,” a special 40-page booklet by Paul Kahn, Liuhuaying Yang, and Hugh Dubberly. This unique project explores the ways data journalism teams visualized massive quantities through different chart types and approaches from around the world. If you’d like to learn more, I interviewed the authors here. We are thrilled to present this supplement in collaboration with Northeastern University and are proud to support such important research from across the dataviz community.
Since our theme for Issue 2 is inspiration, we really tried hard to pack in as many inspiring data visualizations as we could. Richard Brath shows off plenty of inspiring approaches to incorporating text in his article, while our creative director Julie Brunet has fun with some twisted takes on Agatha Christie book covers.


There’s just too much to cover here, and guess what – since Issue 2 is sold out already – here’s your annual reminder that all paying DVS members can find the digital copy of the magazine in the Member Resources area of the Data Visualization Society website.
Super-mega thanks to Claire Santoro, Mary Aviles, Julie Brunet, our editorial committee, the DVS board of directors for their continued support, and of course YOU—the data visualization community, for being loyal Nightingale readers and contributors!
Want to share your thoughts on Issue 2 or suggestions for Issue 3? Drop us a line – get in touch, send us your ideas, get involved!

Jason Forrest is a data visualization designer and writer living in New York City. He is the director of the Data Visualization Lab for McKinsey and Company. In addition to being on the board of directors of the Data Visualization Society, he is also the editor-in-chief of Nightingale: The Journal of the Data Visualization Society. He writes about the intersection of culture and information design and is currently working on a book about pictorial statistics.
- Jason Forrest

- Jason Forrest

- Jason Forrest

- Jason Forrest


