
One of the most powerful examples of data visualization was made 118 years ago by an all-black team led by W.E.B. Du Bois only 37 years after the end of Slavery in the United States.
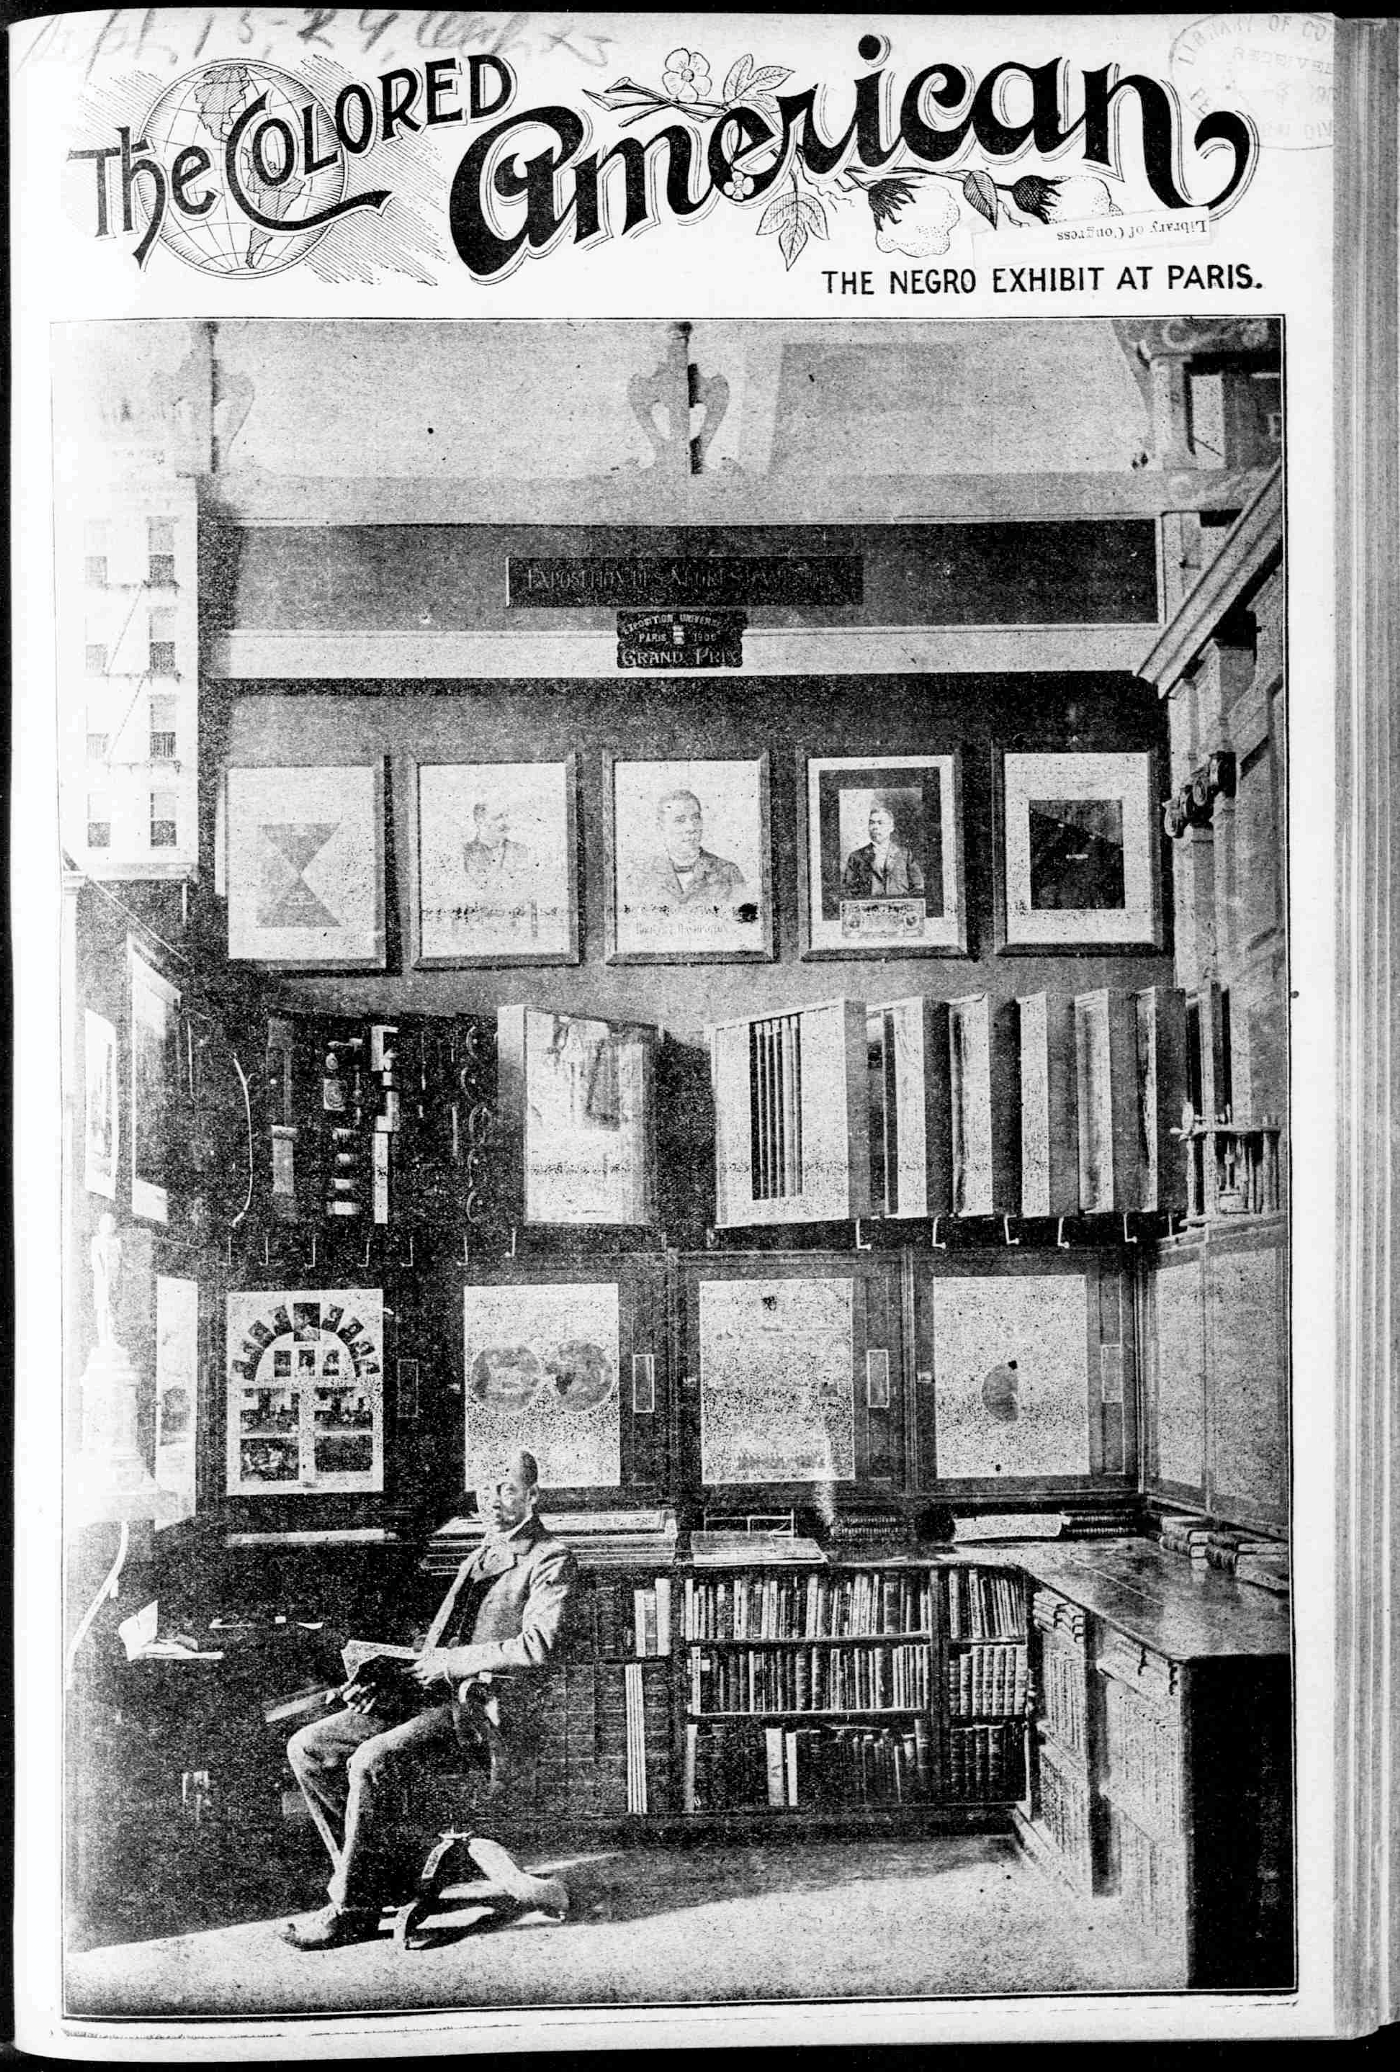
“The Exhibit of American Negroes” at the Exposition Universelle of 1900 in Paris was created by activist and sociologist W. E. B. Du Bois, in collaboration with Booker T Washington, prominent black lawyer Thomas J. Calloway, the assistant librarian at the Library of Congress Daniel Murray, along with students from historically black college Atlanta University.
While Du Bois’ legacy is cemented in American history, his data visualizations remain relatively unknown. I’m passionate about Du Bois’ story and have beendiscussing it through the lens of a UX Designer working in data visualization. My hope is that these posts inspire more academics, designers, and data visualization specialists to explore this work further in order to place the work into the proper historical significance it deserves.
This is article 3 of a 6-part series that covers many aspects of Du Bois’s exhibition, and links to all articles are at the end. Be sure to check out the last one – there’s a big reveal!
The word “Negro” will appear frequently in this series. It’s not a word I take lightly. It is the term Du Bois references throughout this phase of his career and I think it’s best to honor and contextualize his use of language for this article.
Discovering How These Charts Were Made
As discussed in the previous chapter of this series, Du Bois began assembling the exhibit on December 28, 1899. The Paris Exposition began on Apr 15, 1900 and the travel would take at least 6 weeks by ship. Du Bois did not have very much time.
In his Autobiography (written at the age of 90) Du Bois briefly explains how he crafted the charts:
“I got a couple of my best students and put a series of facts into charts: the size and growth of the Negro American group; its division by age and sex; its distribution, education and occupations; its books and periodicals. We made a most interesting set of drawings, limned on pasteboard cards about a yard square and mounted on a number of moveable standards. The details of finishing these 50 or more charts, in colors, with accuracy, was terribly difficult with little money, limited time and not much encouragement.”
Beyond this quote, there is relatively little information about the creation of the actual charts but there are documents from the time that might help explain how this work was created.
The preface of “A Textbook on Ornamental Design” from 1901 instructs that it is “… [to] be used as a work of reference by the practical designer in the solution of the numerous problems that confront him in his everyday work.” Created for correspondence schools, this manual outlines many of the technical tricks of 19th-century draftsmanship for a general audience.


Illustrations from “A Textbook on Ornamental Design”, 1901, International Correspondence Schools
It begins with a description of how to build a sturdy drawing board, the basic use of a T-square, a drafting triangle, a compass, a divider (like a compass but with 2 steel points used for measuring distances) and then explicit directions on how to sharpen a pencil. The book then goes into inking, and as you can see from the illustration at the left, the hand lightly rests on a T-square which then guides the pen. The book is written in a style that provides basic explanation for the beginner but not a lot of actual instruction.
As we have already observed in Du Bois’ work, it is difficult to understand how expertly the charts are drafted using such rudimentary tools. The textbook helps us understand how Du Bois’ team drafts such perfect curvilinear lines when it covers what is now a near-lost-art: the use of the French Curve: “It is usually difficult to draw a smooth, continuous curve…by always fitting the curve to at least three points, and, when moving it to a new position, by setting it so that it will coincide with part of the line already drawn.”
The most exciting aspect of this particular book are the sections dedicated to hand-drawn lettering and its importance. “In fact, generally speaking, more time is required to make well-executed letters than to make well-executed drawings of objects. We earnestly request the student to practice lettering, and not to think that that part of the work is of no importance.” The manual gives some directions on several styles of letterforms, but I was shocked by the similarity of the style of block lettering to what we find in Du Bois’ work.
The careful drafting of the letterforms was likely developed into a strict set of measurements that thestudents penciled in with a ruler then fill in with ink.
Below we see details from two of Du Bois’ charts. Of all the works in the original lot, “Family Budgets” is actually a supplemental page of budget numbers that were part of “The Georgia Negro” series. For some reason, it is included twice: the first a partially damaged draft in pencil, and then the second, finished document in ink. Below you can see the same text from both documents:

The above shows both the block and ‘hairline’ text in pencil and ink. As you can see, Du Bois’ team must have set up a system to account for each letter’s measurements (x-height, cap-height, ascenders, etc) for both of the typeface styles in order to make the work more standardized and easier to draft for multiple students. Additionally, the team only used all-capital letters for all the charts and opted to remove any curves in the letterforms. As demonstrated in the “G” in “Budgets” above, each curve is reduced to a series of angles.
Considering Du Bois and his team were under such strict time constraints, luxuries like printing were clearly out of the question. The work would need to be hand painted watercolor on thick card stock, and it’s likely that Du Bois chose to use watercolors by George C. Osborne.

Based in Philadelphia — where Du Bois also lived until a year before he began this work — Osborne was one of the few 19th-century American makers of artists paint. Many artists of the time believed the especially vivid paint colors by Osborne were equal or better to any made in Europe.
The limited palette in the image above can be seen directly in Du Bois’ color choices; defining a spare, crisp and elegant style that relies heavily on saturated primary colors. I point this out specifically because Du Bois’ use of color likely figures into what is the biggest misconception about this body of work: that it was a precursor to modernism.
The (Understandable) Mistake of Modernism
While the data visualizations of W.E.B. Du Bois are certainly under-recognized, they have been reported on over the past few years. Great articles have appeared in Hyperallergic, Brainpickings, The Public Domain Review, and on the Smithsonian’s blog. While the coverage of this work has been highly considered, I think the general representation of the work might not be entirely accurate.
In 2016 Allison Meier published a detailed article in Hyperallergic, where she understandably writes:
Looking at the charts, they’re strikingly vibrant and modern, almost anticipating the crossing lines of Piet Mondrian or the intersecting shapes of Wassily Kandinsky.
While Meier correctly elaborates on the idea by putting it into context in the 19th century,the sentence above set in motion a ripple echoed in many of the subsequent articles — that somehow Du Bois’ work could be connected to modernism. >While the promise of the statement is exciting, it is not very likely.
Statistical Chart Making in 1900
The rise of the sciences in the 19th centurywas palpable. Technological inventions (the steam engine, electric motor, light bulb, photograph, and telegraph) were regularly introduced. New theories in mathematics, physics, and medicine were popularized, and then the world was turned on its head by Charles Darwin. Each of these inventions was communicated and documented using some sort of visualization. What is the periodic table of elements if not a chart?

Michael Friendly, in his 2006 book The Golden Age of Statistical Graphics, introduces his fantastic research on the history of data visualization: “Statistical graphics and data visualization have long histories, but their modern forms began only in the early 1800s. Between roughly 1850 and 1900, an explosive growth occurred in both the general use of graphic methods and the range of topics to which they were applied. Innovations were prodigious and some of themost exquisite graphics ever produced appeared, resulting in what may be called the “Golden Age of Statistical Graphics.”

As mentioned in part 2 of this series, Du Bois wanted his work to be “outstanding [in a] way which would bring my work to notice by the thinking world.” An incredibly astute academic, Du Bois had studied many sociological texts including the work of Henry Gannett, which was referenced in “The Philadelphia Negro” the year before the Paris Exhibition. So it is obvious that Du Bois was familiar with Gannett’s amazingStatistical Atlas of the United Statesfeaturing luxuriously illustrated maps and charts as well as sociological data he incorporated into his work.
Seeing as Du Bois was setting off on a career as an academic and social scientist and that “The Exhibit of American Negroes” was under a severe timeline, his priority was to craft beautiful charts which were as meaningful as possible with the modest tools at hand. Had the team been allotted enough funds and given the time, the charts might have been printed in color and would have likely looked like the work of Gannett.
Necessity being the mother of invention, Du Bois’s creative brilliance was instead put on display and the resulting handmade charts possess an artistic dimension that is missing from the more scientific work of the time. He likely chose basic, primary colors for their ability to easily imprint on his scientifically minded European audience. He stripped away any decoration in order to make the charts more effective and the precision of the charts conveyed scientific authenticity. While the works are remarkably beautiful, they were likely crafted for influence, not artistic merit.

While precursors to Modernism were present in the 19th century, the concept of modernism wasn’t established until the other ‘-isms’ had crystallized around Europe in the first years of the 20th century. France saw Cubism born in 1907, Die Brücke in Germany in 1906, Italian Futurism in 1909, Russian Constructivism in 1910, all eventually leading to the establishment of the Bauhaus in 1919.
It is with the Bauhaus and the Vienna Circle ;that art and design gained inspiration from science in bringing a more structured approach to the evidence of design. Walter Gropius, László Moholy-Nagy, Wassily Kandinsky, and many at the Bauhaus school stripped away the decoration from art and design to reveal a studied efficiency of form and color.
Unfortunately, most of the modernists were simply too young to have been directly inspired by the works at the Exposition. Picasso was 19 at the time, Gropius 17, Moholy-Nagy was only 5. Piet Mondrian was 28 but was living in The Netherlands. Kandinsky was 28 but had just traded a career in law to go to art school in Munich.
The fusion of science and art helped fuel the Bauhaus and Vienna Circle and certainly Du Bois was operating in a similar space two decades earlier — but as a sociologist. One can only imagine what might have happened if he and his team had found the right support at the Paris Exposition. Had the impact of The Exhibit of American Negroes been an international touchstone instead of a mere ‘success’ Du Bois might have continued to craft statistical charts and the line between this work and what was to come in art and design might have been possible. But that was not the case.
Design & Innovation
What is abundantly clear was that Du Bois was a visionary with a cause; a searing brilliance that could not be diminished, with the drive to impress his plight to a global audience. This work really stands by itself; unique in approach, execution, and historical relevance.
Many of the more unique charts are from “The Georgia Negro” series. Let’s take a look at a few of his most innovative works which also explore African-American socioeconomic growth and land value.

This is one of the most unique charts of Du Bois invention. Elijah Meeks writes: “I call it a Du Bois Spiral. It’s aesthetically compelling in the way it encodes urban to rural demographics….Du Bois knows you cannot precisely compare the lengths of those diagonals and spirals, and so he writes the number to go along with them. It provides the exact number of African Americans living in the various parts of Georgia as well as a more striking summary: the almost absurd ratio of red to any other color.”

Another way of looking at the ‘Du Bois spiral’ above is to envision it as a stacked bar chart on an extremely long scale. Since the single red section is so much larger, Du Bois wanted a way to set it off from the other categories. Since laying it out as a single bar was not visually pleasing, he gained inspiration from another technique that was also common at the time — the “snake.”
In some of Du Bois’s other bar charts such as the “Religion of American Negros” at left, Du Bois uses a “snake” to wrap the largest bar — this time, around itself. Du Bois combines this technique of winding the largest bar into a spiral with another completely unique solution of offsetting the categories as angles to highlight the smaller values.
Of course, the main point of the chart above is to quickly convey just how many African-Americans lived in rural Georgia than in the larger or smaller cities. The large, red spiral immediately leaves an impression; a visual beacon that draws the eye in a way that few charts could.

This one is a real knock-out. Not only do we see the 213.5% increase in acres of land owned, but Du Bois presents us the data in the shape of the state of Georgia itself. As the 25 red bars span the page, the rate of growth is not as impressive as the sense that Negro landowners comprise the entire state of Georgia itself.
A significant accomplishment and proof that African-Americans were prospering in Georgia,the theme of progress is central to the exhibit.Eugene F. Provenzo, in his fantastic book on the exhibit, elaborates: “Black Americans had been isolated as a social group as a result of “color and color prejudice.” They represented a group, who because of “the peculiar environment, the action and reaction of social forces are seen and can be measured with more than usual ease.” By studying the experience of Blacks, Du Bois believed that he could address questions such as “what is human progress and how is it emphasized?”
Providing the data just wasn’t enough, Du Bois needed to show the emerging independence of what he called “a small nation of people.” What better portrait could be drawn?

One of the more surprising charts in the series, the above pictogram;displays the growth of African-American land value as a series of growing bags of money.By showing the millions of dollars owned, it shifts the perception away from poverty and places the African-American landholder in the realm of tangible financial wealth.

The use of pictograms was not common in newspapers at the time but they were used in scientific texts. The cover of the Scientific American at left shows three groups of pictographs in its November, 1899 edition— the month before Du Bois started his work on the exhibition.
Interestingly enough, Du Bois’ work comes two decades before the work of Otto Neurath. An economist and sociologist by trade, Neurath was a co-founder of the Vienna Circle in 1907 and became a highly influential exhibition designer. Neurath eventually developed a visual language for communication that he called the ‘ISOTYPE’ — which is the foundation for many types of contemporary infographics. His mission was to use wordless graphics to illustrate relationships and explain complex ideas to the general public, an aim not dissimilar from Du Bois at the Paris Exhibition.

Another chart in the same sequence on land value and ownership from “The Georgia Negro”, the above chart is another experiment in curvilinear charting. With the success of the ‘Du Bois spiral’ above, Du Bois uses the same concept of ‘snaking’ a traditional bar chart around itself to display an astounding 6673.2% overall growth in Negro home valuables.

To the left, I’ve represented the above Du Bois’ data as a standard vertical bar chart. Represented this way, one can see the overall growth but can also notice the individual trends. Du Bois again opts for the more flashy version, impressing his audience with his draftsmanship and overall impression of meteoric growth.
While visually exciting, this experiment in wrapping bars into a spiral is ultimately not effective in visualizing the data for accuracy. The arbitrary use of a categorical color sequence, especially with the too-light (faded?)1895 category, confuses the interpretation, leaving the 1899 red line to overwhelm the chart and exaggerate its impact.
Also of note is the damage to the work because of the fragility of the materials. Huge chunks of the cardboard are missing, prompting the Library of Congress to put all of the original work in deep storage citing “originals are too fragile to be served.” — but I’ll speak more about that in chapter four.

Initially, I thought the above chart was a Bullseye chart, but those normally show correlations between approximate values. After mulling it over for a while I think this experiment was probably a stacked pie chart. Six years (1875, 1880, 1885, 1990, 1895, and 1899) are depicted by circular areas representing the taxable value of Negro property. As each expands from a black core they are labeled by graphic ‘stalagmites’ showing the 149% increase over the roughly 25 year period.
I’d argue that the above is not a very good data visualization. Since the largest value — the outermost red circle — is depicted as a thin “line” instead of the largest area, it does not read as the largest category. The color selection weakens the message as the black center commands the most attention for the smallest number, and the “clear” section for 1895 reads as empty. The labels literally point to the smallest value, giving the impression that $5,393,885 is the most important number on the page.
Then again, maybe the impression Du Bois was going for wasn’t so wrong after all. By setting a baseline of more than $5 million, Du Bois provides the official financial view of a subset of Georgia citizens. Like the ‘money bags’ chart above, the swirl of multi-million dollar figures on this chart repositions the conceptual understanding of African-American value from what was presumed to be ‘nothing’ to substantial sums of money — even at its minimum.
As a result, I think it’s best to see the above chart as a work of data art. It is surprising, bizarre, challenging and most of all visually exciting. A graphic puzzle designed to lure a curious audience and challenge perceptions.
No rest for the weary
Five months ago when I started this project, I had no idea how far I would get involved in it. I’ve been encouraged by so many people and feel that my work is adding something new to a conversation that I hope is just beginning. When I posted my first Medium article on Du Bois in mid-July, I set off on a 4-part series. But as the research continues I keep learning more and now will have to extend it to 6 parts.

This is partially because I was granted a very special exception by the Library of Congress to visit (only) one of the charts in person — which I did last week. It was very exciting and I need to discuss my findings as well as more of Du Bois’ design innovations in another article to be released soon.
Then, after discussing the legacy of this work, I will also publish another piece that outlines all the charts in order plus discusses another extremely exciting discovery that I’ve made. But I don’t want to spoil any surprises… haha
The six-part series:
W. E. B. Du Bois’ staggering Data Visualizations are as powerful today as they were in 1900
An introduction to the 1900 Paris Exposition, and context for a few charts on history and population growth.
II. Data Journalism and the Scientific Study of “The Negro Problem”
Places this body of work within Du Bois’ larger sociological focus and continues the exploration of many of the charts from the exposition with a focus on education, literacy, and occupation.
III. Exploring the Craft and Design of W.E.B. Du Bois’ Data Visualizations
A detailed examination of how Du Bois drafted his charts, a consideration of this work as a precursor to modernism, and a discussion of his more artistic charts on land ownership and value.
IV. Style and Rich Detail: On Viewing an Original Du Bois Chart
Discoveries on viewing an original chart and further exploration of Du Bois’ more innovative designs dealing with occupation, business, and mortality.
V. Du Bois as Social Scientist and the Legacy of “The Exhibit of American Negroes”
Discusses Du Bois’s body of work and his frustrations with social science despite widespread attention.
VI. The Exhibition as a Whole: an Exciting Discovery
To close out the series I present a previously unknown chart from the series, and discuss the importance of understanding the sequence of the works.
This article originally appeared in Medium but in moving to NightingaleDVS.com, I edited the original text mostly to update some grammar and language substitutions, January 2023.

Jason Forrest is a data visualization designer and writer living in New York City. He is the director of the Data Visualization Lab for McKinsey and Company. In addition to being on the board of directors of the Data Visualization Society, he is also the editor-in-chief of Nightingale: The Journal of the Data Visualization Society. He writes about the intersection of culture and information design and is currently working on a book about pictorial statistics.
- Jason Forrest

- Jason Forrest

- Jason Forrest

- Jason Forrest


